Business analysts frequently navigate complex landscapes of system behavior. When requirements involve intricate branching logic or multiple scenarios, standard diagrams often fall short. This is where the UML Interaction Overview Diagram comes into play. Yet, despite its utility, this modeling artifact remains misunderstood. Many practitioners mistake it for a simple flowchart or believe it duplicates the function of an Activity Diagram. To build robust systems, clarity is essential. This guide addresses the reality of Interaction Overview Diagrams, separating fact from fiction.
For business analysts, understanding this diagram type is not just about technical compliance. It is about precision in communication. It bridges the gap between high-level business logic and detailed technical interactions. By mastering the nuances, you ensure that stakeholders and developers share a single source of truth. Let us explore the core truths, common misconceptions, and practical applications.
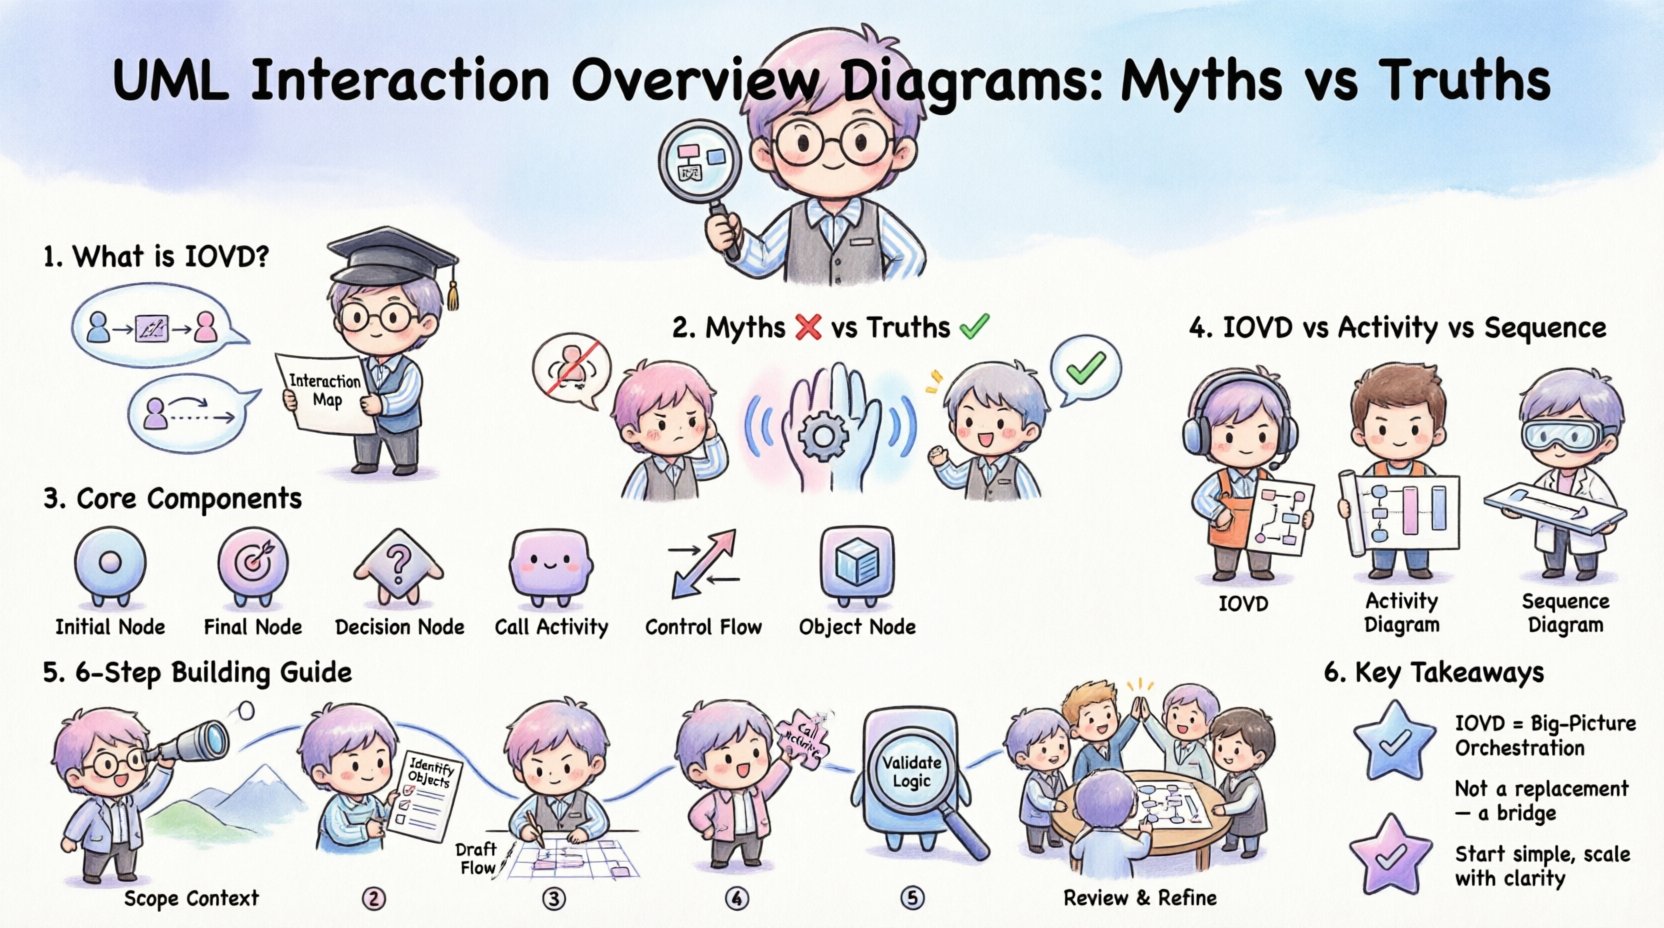
🔍 What is an Interaction Overview Diagram?
An Interaction Overview Diagram is a specialized type of Activity Diagram. Its primary purpose is to show the control flow of interactions between objects or components. Unlike a standard Activity Diagram, which focuses on actions and states, the Interaction Overview Diagram focuses on the *sequence* and *flow* of interactions. It acts as a high-level map that can embed other interaction diagrams, such as Sequence Diagrams, within it.
Think of it as a director’s script for a complex scene. It tells you which scenes (interactions) happen, in what order, and under what conditions. This is particularly useful when a single sequence is insufficient to describe a process. Instead of one long, tangled timeline, you break the process into manageable chunks of interaction, orchestrated by the overview.
⚔️ Common Myths vs. Facts
Confusion often stems from the visual similarity between different UML diagram types. Below is a breakdown of prevalent myths and the corresponding truths.
| Myth ❌ | Truth ✅ |
|---|---|
| It is just a flowchart. | It is an Activity Diagram variant that specifically calls Interaction Diagrams. |
| It replaces Sequence Diagrams. | It orchestrates Sequence Diagrams; it does not replace them. |
| It is only for software developers. | It is critical for BAs to define complex business workflows. |
| All nodes must be actions. | Nodes can be call activities referencing other diagrams. |
| It is too complex for requirements. | It simplifies complex logic by modularizing interactions. |
Understanding these distinctions prevents miscommunication during the requirements phase. If a team assumes the diagram is a flowchart, they may miss the object interaction details embedded within the nodes. If they assume it replaces the Sequence Diagram, they may lose the granularity of message passing.
🧩 Core Components Explained
To construct an Interaction Overview Diagram effectively, you must understand the notation. The diagram utilizes a subset of Activity Diagram notation combined with interaction elements. Here are the essential building blocks:
- Initial Node: The starting point of the interaction flow. It is typically a filled circle.
- Final Node: The termination point of the flow. It is typically a circle within a larger filled circle.
- Decision Node: A diamond shape that represents a branching point. It directs flow based on guard conditions (e.g.,
if_valid,if_invalid). - Call Activity: A rounded rectangle that represents a call to another interaction diagram. This is the defining feature. Instead of drawing every message, you link to a pre-defined Sequence Diagram.
- Control Flow: The arrows connecting the nodes. These indicate the direction of execution.
- Object Node: Represents the state of an object at a specific point in the flow. It holds data or object instances.
The Call Activity node is particularly significant. It allows you to abstract complexity. If a specific interaction is too detailed for the overview level, you create a separate Sequence Diagram. The Call Activity node links to that diagram. This keeps the overview clean while maintaining access to the details.
🔄 Interaction Overview vs. Activity vs. Sequence
Selecting the right diagram depends on the question you need to answer. Using the wrong diagram can lead to ambiguity. Here is how they differ in practice.
- Activity Diagram: Best for high-level business processes. It focuses on actions, decisions, and the flow of control across the entire system. It does not explicitly show object lifelines.
- Sequence Diagram: Best for detailed message passing between specific objects over time. It shows the order of messages but struggles with complex control flow logic (loops, branches) at a high level.
- Interaction Overview Diagram: Best for scenarios requiring both control flow and object interaction. It manages the logic of which Sequence Diagrams to execute and when.
Consider a banking transaction system. An Activity Diagram might show “User Logs In” -> “Checks Balance” -> “Withdraws Funds”. A Sequence Diagram would show the exact messages between the UI, the Authentication Service, and the Ledger. An Interaction Overview Diagram shows the logic: “If balance is sufficient, call Withdrawal Sequence. If not, call Error Sequence.”
🛠 Building an IOVD: A Step-by-Step Approach
Creating this diagram requires a structured approach. It is not a spontaneous drawing exercise. Follow these steps to ensure accuracy and utility.
1. Define the Scope
Identify the specific use case or scenario you are modeling. Do not attempt to map the entire system in one diagram. Select a complex scenario that involves branching logic or multiple interaction paths.
2. Identify the Objects
Determine which objects or components participate in the interaction. You do not need to list every message, but you must know which entities are involved. This informs the Call Activity nodes you will create.
3. Draft the Control Flow
Map out the high-level logic. Use decision nodes to represent conditions. Determine where the flow splits and where it merges. This forms the skeleton of your diagram.
4. Insert Call Activities
For complex interactions, replace detailed message flows with Call Activity nodes. Ensure these nodes are linked to existing Sequence Diagrams. This modularization keeps the overview readable.
5. Validate Guard Conditions
Check every decision node. Ensure that all possible paths are accounted for. For every branch, there should be a clear condition. Avoid dead ends unless they represent a valid system termination.
6. Review with Stakeholders
Walk through the logic with business users. Ask them if the flow matches their expectations. This diagram is a communication tool; if they cannot understand the flow, it has failed its purpose.
⚠️ Pitfalls to Avoid
Even experienced modelers can fall into traps when creating Interaction Overview Diagrams. Awareness of these common errors helps maintain diagram quality.
- Over-Complication: Including too many Call Activities makes the diagram cluttered. If you have more than five or six sub-diagrams, consider simplifying the logic or creating a higher-level overview.
- Ignoring Guard Conditions: Failing to label decision node branches leads to ambiguity. Every path must have a condition attached.
- Mixing Notation: Do not mix standard Activity nodes with Sequence elements randomly. Keep the focus on the flow of interactions. Do not try to draw lifelines directly on the overview diagram.
- Lack of Entry/Exit Points: Ensure every sub-diagram (called via Call Activity) has a clear entry and exit. Ambiguous boundaries cause integration issues later.
- Redundancy: Do not create a Call Activity for a simple interaction that could be drawn directly. Use the overview for orchestration, not for every single message.
🤝 The Business Analyst’s Strategic Advantage
Why should a business analyst invest time in learning this diagram? The answer lies in risk reduction and clarity. Requirements often fail because the logic was not fully visualized.
- Clarifying Complex Logic: Business rules often have exceptions. An Interaction Overview Diagram visualizes these exceptions clearly. It shows where the system deviates from the happy path.
- Reducing Ambiguity: Developers often interpret text requirements differently. A visual flow reduces interpretation variance. It aligns technical implementation with business intent.
- Facilitating Testing: Testers can derive test cases directly from the decision nodes and paths. It provides a map for coverage analysis.
- Managing Scope: By encapsulating details in Call Activities, you can manage the scope of the conversation. You can discuss the high-level flow without getting bogged down in message details immediately.
📝 Integrating IOVD in Requirements Gathering
Integration into the requirements process should be seamless. It is not an afterthought. Here is how to incorporate it into your workflow.
During Elicitation
When gathering requirements, ask about the decision points. If a user says, “If the order is over $100, apply the discount, otherwise…”, mark this as a potential Decision Node. Ask which systems are involved in that decision to identify potential Call Activities.
During Analysis
As you refine requirements, map the text to the diagram. Translate “User submits form” into a flow path. Translate “System validates data” into a Call Activity or Action Node. This ensures the diagram reflects the requirements, not just a theoretical model.
During Validation
Use the diagram as a validation tool. Walk the requirement through the diagram. Does every requirement have a corresponding path? Are there paths that do not meet any requirement? This helps identify gaps in the specification.
🚀 Summary of Key Takeaways
The Interaction Overview Diagram is a powerful tool for modeling complex system behaviors. It sits between the high-level process view and the detailed interaction view. It is not a replacement for other diagrams but a coordinator of them.
- It combines control flow with object interaction.
- It uses Call Activity nodes to embed Sequence Diagrams.
- It is essential for managing branching logic and error handling.
- It provides a clear path for testers and developers.
- It requires careful design to avoid clutter and confusion.
By adopting this diagram type, business analysts can provide more precise specifications. This precision translates to fewer defects, faster development cycles, and systems that align better with business needs. The effort to learn the notation pays off in the clarity of the final product.
🎯 Final Thoughts on Modeling
Modeling is not about drawing pretty pictures. It is about thinking clearly. The Interaction Overview Diagram forces you to think about the logic of interactions, not just the existence of objects. It challenges you to define the conditions under which behaviors occur.
As you move forward, apply these concepts to your next complex requirement. Start small. Model one scenario. Refine the notation. Share it with your team. Through practice, the diagram becomes a natural extension of your analytical process. This ensures that your requirements are not just written, but understood.