


Modern project management demands precision, agility, and scalability—especially in complex, time-sensitive environments such as international conference planning, software launches, or infrastructure rollouts. Central to effective scheduling is the ability to visualize task dependencies, calculate critical paths, and simulate alternative scenarios. Enter AI-powered PERT chart generation—a transformative shift from manual, error-prone network diagramming to dynamic, intelligent project modeling.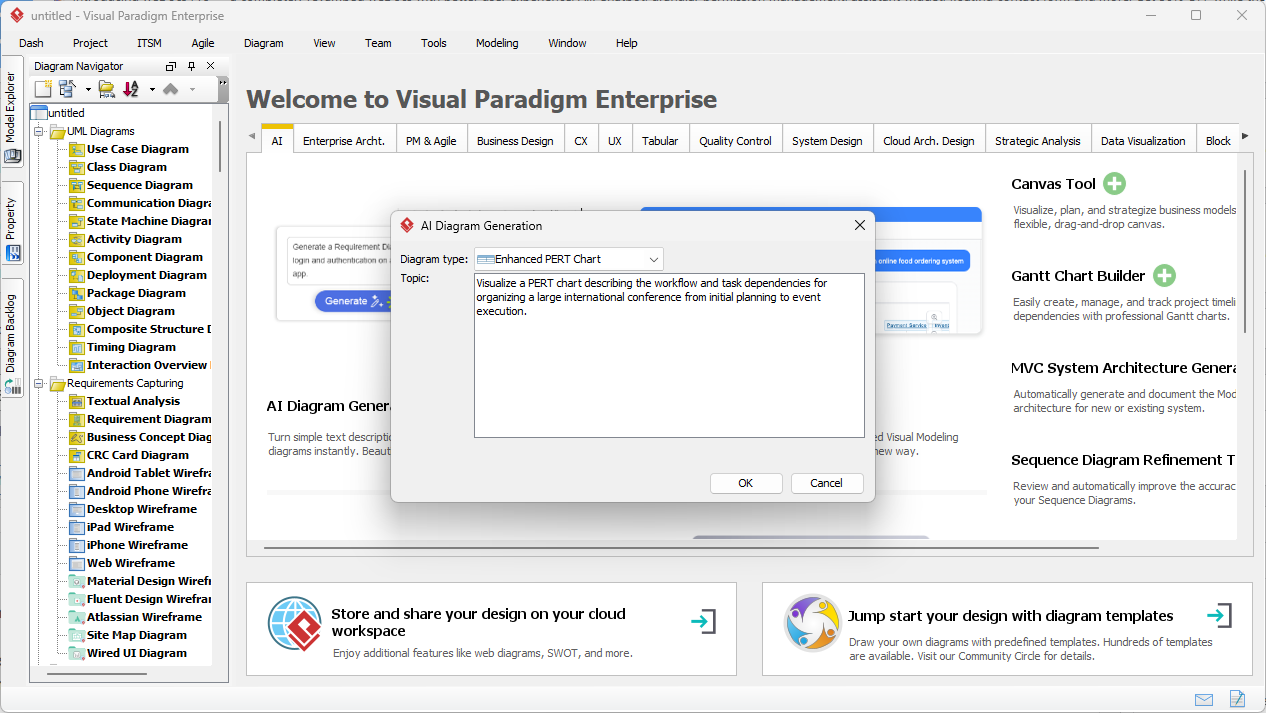
Understanding the Role of PERT Charts in Project Planning
PERT (Program Evaluation and Review Technique) charts are foundational tools in project management for mapping out task sequences, identifying dependencies, and determining the minimum duration required to complete a project. Traditionally, creating a PERT chartinvolved labor-intensive manual work: defining tasks, establishing logical sequences, and performing complex mathematical calculations to determine early/late start and finish times, critical paths, and task slack.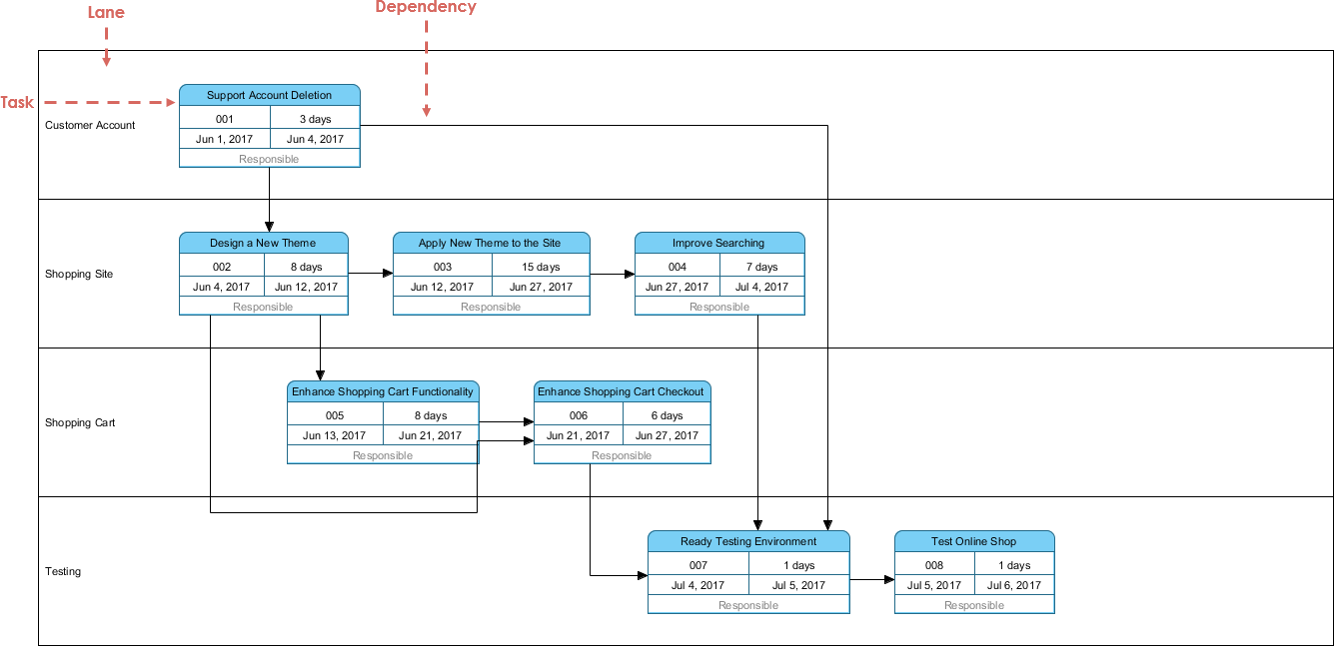
With the integration of generative artificial intelligence, this process has been revolutionized. Tools like Visual Paradigm’s AI PERT chart generatornow translate natural language project descriptions into fully structured, professional-grade network diagrams—complete with accurate timing, dependencies, and risk modeling—all within seconds.
How AI-Powered PERT Chart Generation Works
The core of this innovation lies in the context-aware AI engine embedded within Visual Paradigm’s modeling ecosystem. When a user inputs a project description—such as “Plan a global tech conference from ideation to event execution”—the AI performs several intelligent steps:
- Task Extraction: Identifies key phases (e.g., Planning, Marketing, Logistics, Execution).
- Dependency Inference: Parses logical relationships (e.g., “Marketing starts after research is complete”) and constructs appropriate arrows between nodes.
- Swimlane Assignment: Organizes tasks into logical domains to improve readability and team alignment.
- Duration Estimation: Applies the PERT three-point formula:
TE = (O + 4*M + P) / 6, where O = Optimistic, M = Most Likely, P = Pessimistic. - Network Validation: Ensures all nodes and arrows comply with PERT standards (e.g., event nodes, activity arrows, correct directionality).
This output is not a static image—it is a fully functional, interactive model that supports further refinement, scenario analysis, and integration into enterprise project management workflows.
Step-by-Step Guidelines for Effective Use
Step 1: Define the Project Scope in Natural Language
Begin by articulating the project in clear, conversational terms. Avoid technical jargon; instead, describe the workflow as a human would. For example:
“We are organizing a three-day international conference on AI ethics. Planning begins in Q1, including venue selection, speaker booking, and marketing. Marketing launches three months before the event, and all venue arrangements must be finalized two weeks prior to the event.”
Key elements to include:
- Start and end points of the project
- Key milestones (e.g., final speaker list, venue confirmation)
- Dependencies (e.g., “Marketing can’t begin until research concludes”)
- Time estimates (optimistic, most likely, pessimistic) where possible
Step 2: Generate the Initial PERT Network Diagram
Using the AI Diagram Generation tool in Visual Paradigm Desktop, input the project description into the prompt box. The AI processes the text and outputs a structured PERT chart with:
- Event nodes (circles or rectangles) representing milestones
- Activity arrows indicating task dependencies
- Task IDs, durations, and assigned personnel (e.g., Alice – Marketing)
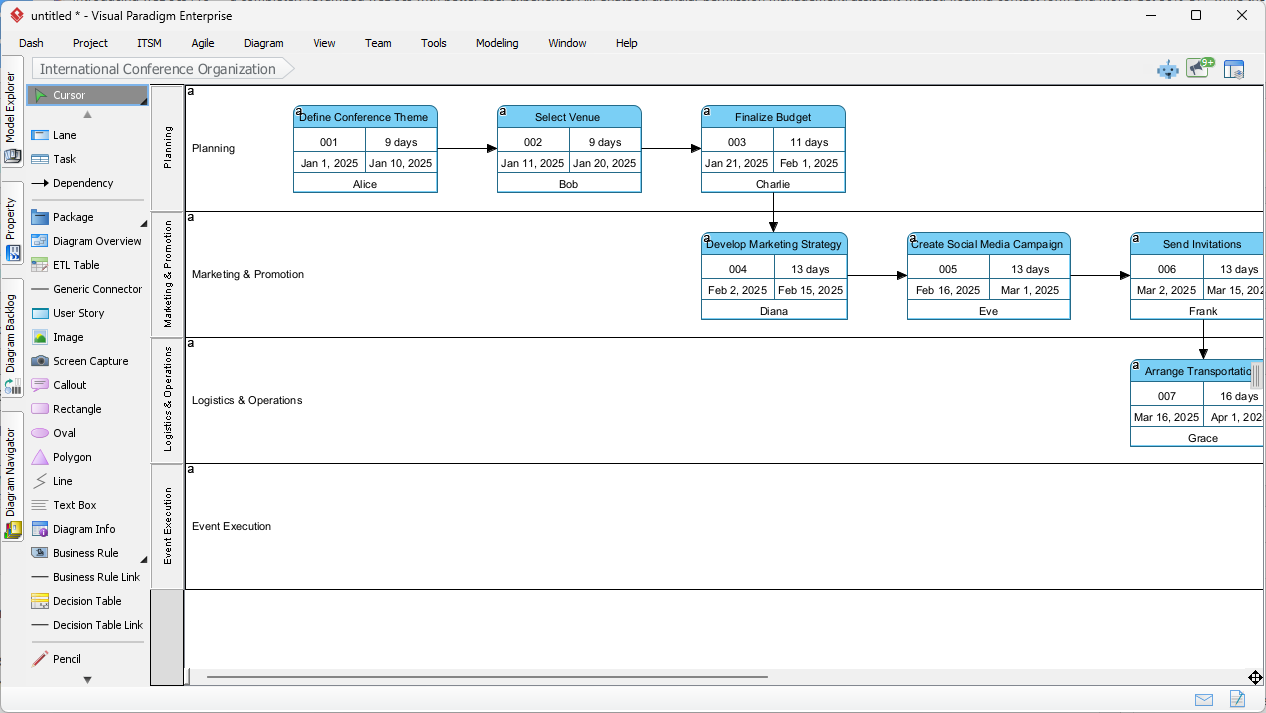
- Clear swimlane separation for Planning, Logistics, Marketing, Execution
The diagram automatically highlights the critical path—the sequence of tasks with zero slack—showing the minimum time required for project completion.
Step 3: Refine and Validate the Model
While the AI handles 80% of the structural creation, human oversight remains essential. Use the following refinement steps:
- Adjust task durations based on real-world constraints or stakeholder input.
- Modify dependencies to reflect actual workflow constraints (e.g., “Event setup cannot begin until insurance is approved”).
- Introduce lags or buffers between dependent tasks to account for risk or resource availability.
- Apply three-point estimates to improve accuracy and support probabilistic scheduling.
This hybrid approach—AI for rapid prototyping, humans for strategic validation—maximizes accuracy and reduces scheduling errors in high-stakes environments.
Step 4: Perform Scenario and Risk Analysis
One of the greatest advantages of AI-powered PERT generation is its ability to support what-if analysis:
- Generate a “best-case scenario” with optimistic durations.
- Generate a “pessimistic scenario” with extended timeframes and added delays.
- Compare total project durations and identify new critical paths.
- Highlight tasks with high slack that can be rescheduled without impact.
This enables project leaders to present a comprehensive risk assessment to stakeholders, including contingency plans and buffer recommendations.
Core Technical Advantages of AI-Driven PERT Modeling
Automated Critical Path Analysis
The AI engine automatically computes early and late start/finish times through forward and backward passes. It then identifies tasks with zero slack—those on the critical path—and highlights them in the diagram. This allows teams to prioritize resources and monitor progress in real time.
Probabilistic Scheduling with Real-World Accuracy
Instead of fixed durations, the AI supports three-point estimates, enabling realistic modeling of uncertainty. This is especially valuable in dynamic environments where delays are common (e.g., supply chain issues, speaker cancellations).
Seamless Integration with Industry Standards
All generated diagrams follow established visual modeling standards:
- Event nodes (circles or rectangles) for milestones
- Activity arrows with clear direction
- Correct labeling of task IDs, durations, and dependencies
- Compliance with PMP-level reporting requirements
These outputs are directly suitable for inclusion in project documentation, executive summaries, and audit trails.
Multi-Platform Access and Flexibility
Users can leverage the full power of AI in two primary environments:
| Platform | Use Case | Access Method |
|---|---|---|
| Visual Paradigm Desktop | Enterprise-level modeling, team collaboration, Gantt integration | Installed software with full feature access |
| Visual Paradigm AI Chatbot (Web) | Quick ideation, live meetings, brainstorming sessions | Browser-based, no installation required |
For example, during a stand-up meeting, a team lead can simply say: “Generate a PERT chart for a mobile app launch with a 6-month timeline.” The chatbot instantly delivers a structured diagram with dependencies and key dates, enabling real-time decision-making.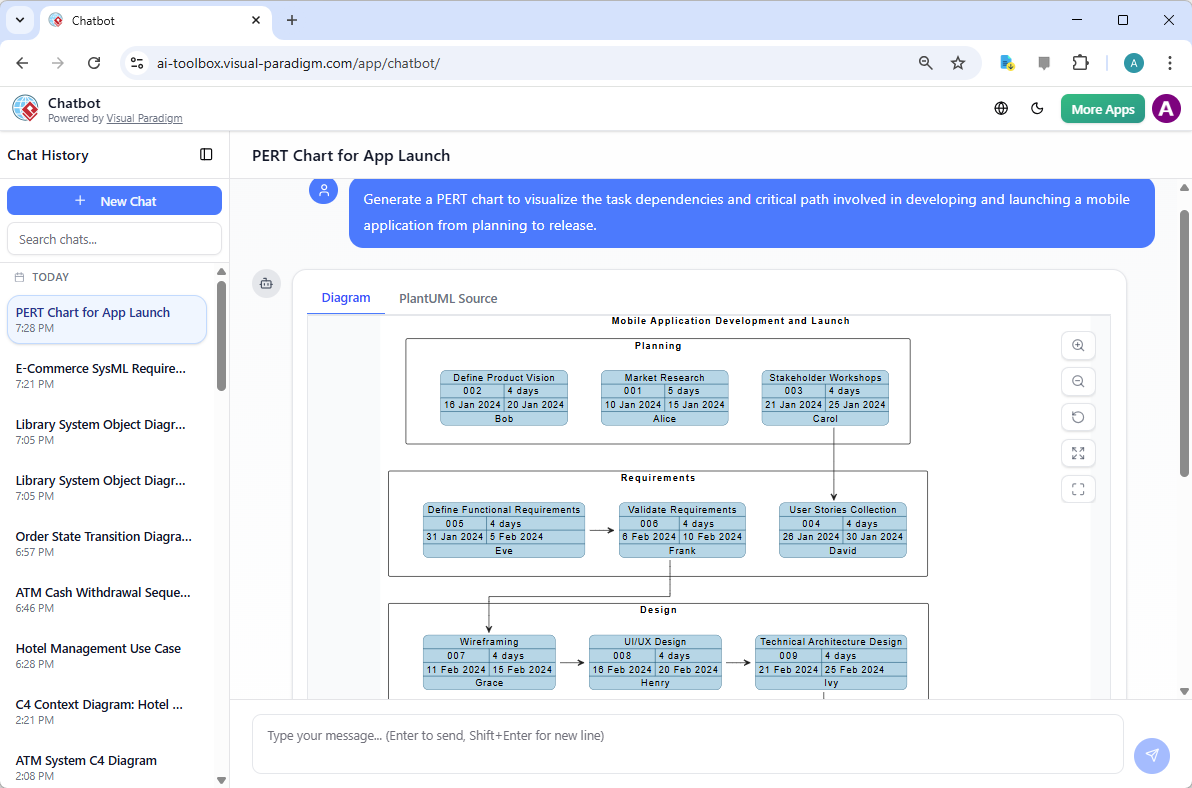
Real-World Application Workflows
Workflow 1: From Concept to Execution Diagram
- Open Visual Paradigm Desktop and launch the AI Diagram Generation tool.
- Enter the project description: “We are launching a new fintech app with a 12-month roadmap. Research comes first, followed by UI/UX design, development, testing, and final deployment.”
- AI generates a PERT chart with clear swimlanes and dependency logic.
- Review and refine durations and dependencies based on team input.
- Export the chart and save it in the team’s project repository for version control and collaboration.
Workflow 2: Scenario Testing for Risk Mitigation
- Create a baseline PERT chart using the best-case timeline.
- Modify the prompt to include pessimistic estimates: “Include a 30% delay in the development phase due to third-party API instability.”
- Generate a second version and compare total project duration and new critical path.
- Present findings to stakeholders with clear recommendations on buffer allocation and risk response.
Why This Matters in Today’s Project Management Landscape
The integration of generative AI into visual modeling marks a significant evolution in project scheduling. It shifts the focus from task choreography to strategic foresight.
Project managers no longer need to spend hours manually drawing arrows or calculating floats. Instead, they can:
- Focus on stakeholder communication and risk mitigation
- Conduct rapid scenario analysis to respond to market changes
- Ensure alignment across cross-functional teams through visual clarity
- Deliver timelines that reflect both optimism and preparedness
Conclusion: The Future of Project Scheduling
AI-powered PERT chart generation is not a novelty—it is a necessity in modern, agile project environments. By automating the most time-consuming and error-prone aspects of network diagramming, tools like Visual Paradigm enable project leaders to move faster, make better decisions, and deliver with greater confidence.
With a blend of intuitive natural language input, robust mathematical modeling, and professional-grade output, these tools democratize access to advanced project management techniques—even for those without formal training in network analysis.
For organizations managing complex, multi-phase projects—from global conferences to software product launches—this technology delivers tangible benefits in schedule accuracy, team efficiency, and stakeholder trust.
Get Started Today
Begin your journey with AI-driven project modeling by trying the free version of Visual Paradigm or accessing the online AI Chatbot. Whether you’re a project manager, team lead, or enterprise architect, you now have the tools to turn ideas into structured, actionable plans in minutes.
DownloadVisual Paradigm Desktop to access full AI diagram capabilities, or explore the Visual Paradigm AI Chatbot in your browser for instant prototyping.
Articles and resources related to Visual Paradigm’s AI capabilities and PERT Chart tools for project management:
-
Pert Chart Tool – Visual Paradigm Online: A powerful online tool designed to help project managers visualize task dependencies, estimate timelines, and manage project schedules effectively.
-
Complete PERT Chart Tutorial – Visual Paradigm: A step-by-step tutorial guiding users through creating and using PERT charts in the cloud to plan and manage complex projects efficiently.
-
Pert Chart User Guide – Visual Paradigm: Detailed documentation covering how to create, edit, and utilize PERT charts within the desktop software for robust project management.
-
Free PERT Chart Templates – Visual Paradigm: Access a collection of professionally designed templates to kickstart project planning with minimal setup.
-
Pert Chart Tutorial – Visual Paradigm Knowledge Base: An in-depth resource explaining the purpose, construction, and application of PERT charts in real-world project management scenarios.
-
Enhanced PERT Chart Features – Visual Paradigm: Explore advanced capabilities such as dynamic scheduling, critical path analysis, and seamless integration with project timelines.
-
Project Management Guide – Visual Paradigm User Guide: A comprehensive guide to the platform’s project management suite, including PERT charts, Gantt charts, and resource allocation tools.
-
Pert Chart for Project Management – Cybermedian: This article provides practical insights and real-world online examples for using PERT charts to improve project planning.
-
Integrating PERT Charts with RACI Roles in Task Management: A practical guide on combining PERT charts with RACI roles to enhance timeline accuracy and accountability in management workflows.
-
Visual Paradigm AI Suite: A Comprehensive Guide: This overview details how the platform’s AI Chatbot supports the generation of business diagrams, explicitly including PERT charts, within the modeling environment.