


Imagine you are tasked with designing the architecture for a new e-commerce platform. You know exactly how the business works: customers add items to a cart, place orders, and payments are processed while inventory is updated. However, translating that mental model into a structured, technical diagram usually involves hours of dragging shapes and manually routing arrows. With the AI Data Flow Diagram generation capabilities in Visual Paradigm, this tedious process is transformed into a simple conversation.
This powerful diagramming software allows users to describe systems in plain English and instantly receive a professional-grade Data Flow Diagram (DFD). Whether you are a business analyst mapping requirements or a student learning system design, this tool bridges the gap between your ideas and visual documentation.
Quick Summary: Key Takeaways
- Instant Visualization: Converts natural language text into structured DFDs automatically.
- Flexible Notations: Supports standard, Gane-Sarson, Yourdon & Coad, and Yourdon DeMarco styles.
- Intelligent Parsing: Automatically identifies External Entities, Processes, Data Stores, and Flows.
- Full Editability: The generated result is a native diagram that can be refined, edited, and expanded.
- Level Support: Capable of generating Context (Level 0) and Level 1 diagrams based on detail.
Step 1: Describing the System Logic
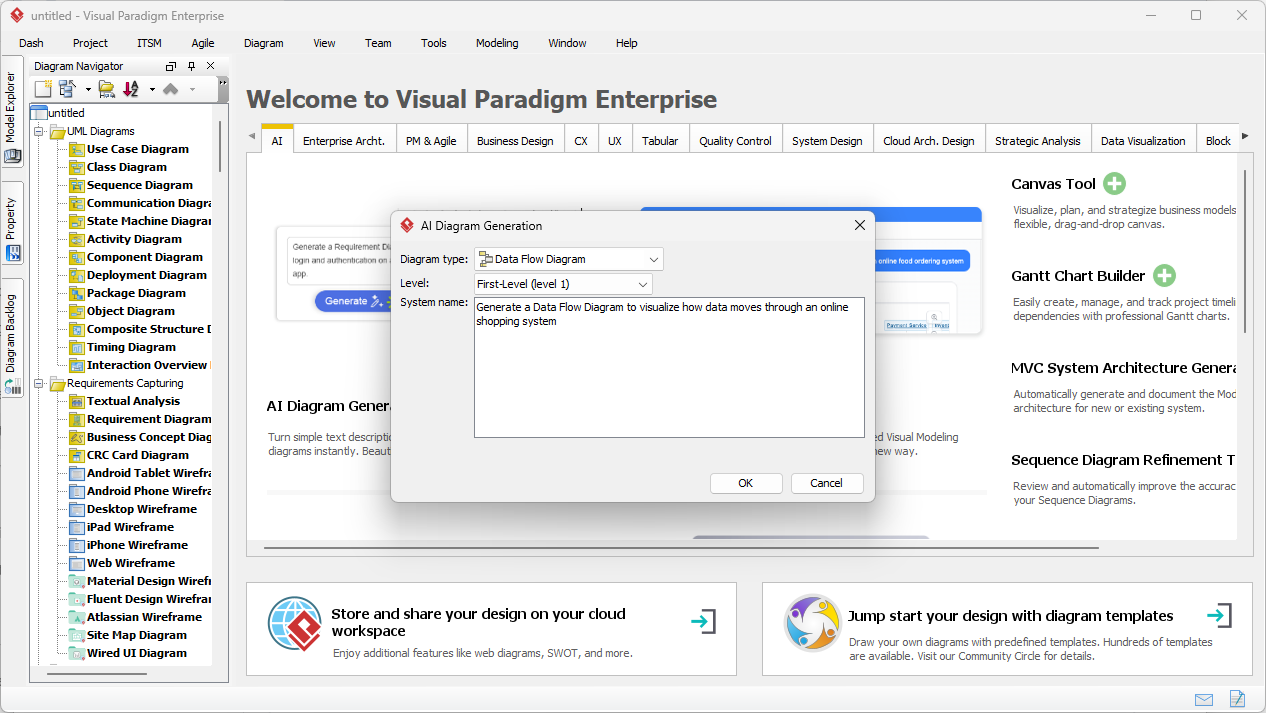
The journey begins with a blank canvas and a clear idea. In Visual Paradigm Desktop, you don’t need to start by selecting tools from a palette. Instead, you access the AI Diagram Generation feature. The interface is clean and straightforward, asking only for the type of diagram you need and a description of what you are building.
In the example below, we are creating a model for an e-commerce platform. We have selected “Data Flow Diagram” as the type and specified “First-Level (level 1)” for the depth. The most important part is the system name or prompt. Here, the user has entered: “Generate a Data Flow Diagram to visualize how data moves through an online shopping system.” This simple instruction is all the AI needs to start analyzing the logical connections required for the diagram.
How the AI Understands Your Request
When you click “OK,” the AI-powered diagram tool analyzes your text using advanced natural language processing. It breaks down the sentence structure to understand the “who,” “what,” and “where” of your data:
- Nouns become Entities or Stores: Words like “Customer” or “Admin” are identified as External Entities. “Database” or “Inventory” are recognized as Data Stores.
- Verbs become Processes: Actions such as “Process Payment” or “Update Catalog” are converted into Process bubbles.
- Context becomes Flow: The relationship between these elements determines the direction of the arrows (Data Flows).
Step 2: Reviewing the Generated Diagram
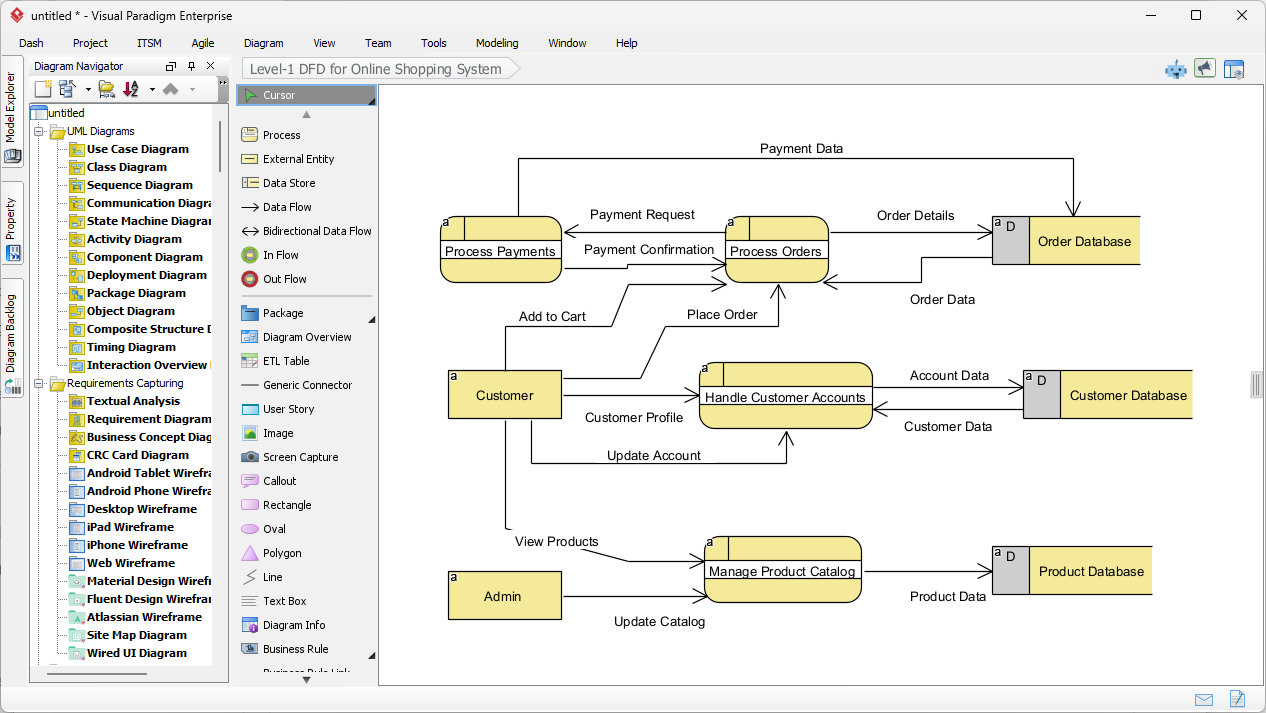
Moments after submitting the description, Visual Paradigm presents a fully constructed Level-1 Data Flow Diagram. The result is not just a static image, but a fully editable model. As seen in the generated output, the AI has logically organized the complexities of an online shopping system into a clear, readable visual format.
Notice how the diagram captures the essential interactions. The “Customer” entity on the left connects to the “Handle Customer Accounts” process. Flows are correctly labeled with data packets like “Customer Profile” and “Account Data.” The system has also intelligently placed Data Stores on the right, such as the “Order Database” and “Product Database,” ensuring the layout follows standard design practices where data moves from left (source) to right (storage).
Understanding the Visual Elements
The generated diagram uses specific symbols to represent different parts of the system. In this specific view, the software has utilized a notation style similar to Gane-Sarson, characterized by rounded rectangles for processes and open-ended rectangles for data stores.
- Processes (Rounded Rectangles): The yellow shapes like “Process Payments” and “Manage Product Catalog” represent where data is transformed.
- External Entities (Rectangles): The “Customer” and “Admin” boxes represent users or systems outside the scope of control that interact with the main system.
- Data Flows (Arrows): The lines show the path of information, such as “Payment Request” moving from the payment process to the order database.
Refining and Standardizing Your Model
One of the standout features of this professional design tool is its flexibility with notation standards. While the AI generates a solid foundation, you might be working on a project that requires a specific academic or industry standard. Visual Paradigm supports multiple DFD notations, including:
- Yourdon & Coad: Uses circles for processes.
- Yourdon DeMarco: Uses circles for processes and generic curves for flows.
- Gane-Sarson: As shown above, using rounded rectangles.
Because the generated diagram is fully integrated into the editor, you can easily decompose these processes further. For instance, you could click on “Process Orders” and generate a child diagram to show exactly how an order is validated, picked, and packed. This makes it an ideal solution for system analysts who need to start with a high-level view and drill down into the details.
Conclusion
Using AI to generate Data Flow Diagrams in Visual Paradigm shifts the focus from drawing to designing. By simply describing the flow of an online shopping system, we were able to produce a comprehensive Level-1 DFD in seconds. This workflow eliminates the blank-page syndrome and ensures that your documentation is structured, standardized, and ready for development.
Ready to streamline your system analysis and diagramming workflow? Start your design journey today.
Try Visual Paradigm Desktop Free
Related Links
Data Flow Diagrams (DFD) are graphical representations used in business information systems to visualize how data moves through a system, illustrating key processes, data stores, and external entities. Visual Paradigm provides a comprehensive ecosystem for DFD modeling, offering both desktop and web-based solutions that support collaboration and professional-grade documentation. Recent updates have further enhanced these tools by integrating AI-driven automation, which allows users to generate editable DFDs instantly from natural language descriptions. By utilizing specialized drag-and-drop editors and a vast library of pre-made templates, architects and business analysts can demystify complex information flows and ensure that system designs align with operational requirements.
-
Interactive Data Flow Diagram Maker Tool: A powerful online tool designed for creating professional DFDs with clarity and ease of use.
-
What is Data Flow Diagram? – Comprehensive Guide: A foundational resource explaining the notation, symbols, and role of DFDs in system modeling.
-
Step-by-Step DFD Tutorial Guide: A beginner-friendly tutorial that walks users through the process of building effective data flow models.
-
Advanced Data Flow Diagram Tool Features: An overview of the advanced editing, sharing, and precision-modeling capabilities within the platform.
-
Free Online DFD Drawing Solution: A complete browser-based solution for creating and sharing DFDs without the need for local installation.
-
Unlock the Power of Data Flow Diagrams (DFD) with Visual Paradigm: Explores how the Visual Paradigm ecosystem supports efficient design and team collaboration for DFD projects.
-
Demystifying Information Flow with DFDs: A detailed guide on how DFDs represent the movement of information across various system components.
-
Data Flow Diagram Templates – Visual Paradigm Online: A repository of ready-to-use templates to accelerate the design of business information systems.
-
How to Draw Data Flow Diagram (DFD) – Official User Guide: Technical documentation providing step-by-step instructions on drawing and customizing DFDs using intuitive design tools.
-
AI Diagram Generator – Instant Creation of DFDs from Text: Information on the latest AI features that enable users to create structured DFDs automatically from simple text prompts.