


At a mid-sized B2B wholesale distributor, order processing was plagued by confusion. Sales reps, warehouse staff, and customer service teams were constantly misaligned on the status of orders—was it “placed” or “paid”? Was “shipped” the same as “delivered”? The lack of a clear, shared model led to delays, customer complaints, and manual reconciliation efforts that consumed hours each week. The team needed a visual way to define and communicate the full lifecycle of an order, from draft to delivery or return. With Visual Paradigm Desktop’s AI Diagram Generation, they created a precise, professional State Machine Diagram in under a minute—no coding, no design expertise required. This article walks through how they transformed their internal clarity, used the AI-generated diagram as a living model, and unlocked faster decision-making. By the end, you’ll see how AI doesn’t replace modeling—it supercharges it.
What is a State Machine Diagram?
A State Machine Diagram (also known as a State Diagram or Statechart Diagram) is a behavioral UML diagram that models the lifecycle of an object or process by showing its possible states and the transitions between them. Each state represents a condition or mode the system is in, and transitions occur when specific events or conditions trigger a change. This diagram is especially powerful for systems with complex, condition-dependent workflows—such as order processing, user authentication, or device control.
Key elements include states (represented as rounded rectangles), transitions (arrows between states), initial and final states (a filled circle and a filled circle with a border), and guard conditions (expressions that must be true for a transition to occur). Events, actions, and entry/exit points can also be annotated to provide deeper insight into behavior.
Common use cases span industries: in logistics, it tracks shipment stages; in software, it models user session states; in manufacturing, it manages machine operation modes. For example, a customer’s account might transition from “inactive” to “pending verification” after email confirmation, then to “active” upon payment. In e-commerce, a shopping cart can move from “empty” to “active” when items are added, and then to “checkout” or “abandoned” based on user behavior.
The Managing Order Lifecycle States Project at a Glance
A mid-sized B2B wholesale distributor faced growing operational friction due to inconsistent understanding of order status transitions. Their sales team would mark orders as “placed” too early, warehouse staff didn’t know when to begin picking, and customer service struggled to explain why an order was “shipped” but not yet “delivered.” The root cause? No standardized visual model of the order lifecycle.
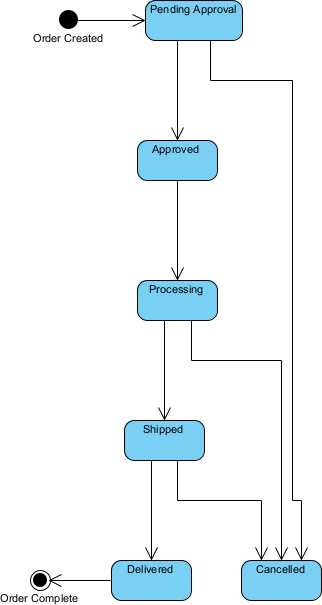
They needed a State Machine Diagram to define the complete journey of an order: from draft, to placed, paid, picking, shipped, delivered, and optionally returned. This diagram had to be accurate, easy to understand across departments, and serve as a single source of truth for process alignment.
- Multiple teams used different terminology for the same status.
- Manual documentation was outdated and inconsistent.
- Process delays occurred due to unclear transition triggers.
- Training new staff took days, not hours.
- There was no way to simulate or audit the workflow.
Creating this diagram manually would have taken days of meetings, revisions, and design work. Instead, they turned to Visual Paradigm Desktop’s AI Diagram Generation to create a professional, accurate State Machine Diagram in seconds.
Why Generate State Machine Diagram with AI?
- Transforms vague process descriptions into a structured, visual model in seconds.
- Eliminates the need for design skills—no drawing or layout expertise required.
- Provides a consistent starting point across teams and departments.
- Enables rapid iteration during workshops or stakeholder alignment sessions.
AI generation shines in early ideation and rapid prototyping. When a team is brainstorming a complex workflow—like an order lifecycle—AI can instantly produce a draft that captures the core logic. This is especially valuable in cross-functional workshops where stakeholders from sales, logistics, and IT need to align quickly. It also helps in onboarding new team members: instead of reading dense documents, they can see the process in motion. For cost-sensitive projects or teams with limited modeling experience, AI cuts the learning curve dramatically. It’s not about replacing human judgment—it’s about accelerating it. With Visual Paradigm, you get instant AI generation combined with a full-featured modeling platform, so the diagram isn’t just a pretty picture—it’s a living model ready for refinement, simulation, and integration.
How to Generate a State Machine Diagram in Seconds with Visual Paradigm Desktop
- Launch Visual Paradigm Desktop Professional or Enterprise Edition.
- Go to menu Tools → AI Diagram Generation.
- In the AI Diagram Generation window, choose State Machine Diagram in the Diagram Type dropdown.
- In the Topic field, write a clear description in plain English.
Recommended prompt example for this case (copy-paste friendly):
“Create a State Machine Diagram for a B2B wholesale order lifecycle.”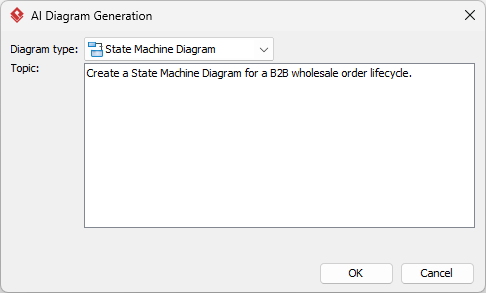
- Click OK.
The AI produces a clean, editable diagram in seconds.
Reviewing and Refining Your AI-Generated Diagram
AI gives an excellent starting point — refinement is where professional modeling tools shine.
Quick Visual & Structural Touch-ups
After generation, use the built-in auto-layout tools to align states and smooth transitions. Reorder states for better flow (e.g., left-to-right for chronological order). Use color themes to highlight critical paths—like paid → picking—while keeping inactive states visually distinct. Add notes to explain guard conditions or business rules. Straighten any curved lines and ensure all transitions are clearly labeled. These small edits make the diagram instantly more professional and easier to share.
Leveraging Full Modeling Power for This State Machine Diagram
What makes Visual Paradigm truly powerful is that the AI-generated diagram isn’t a dead end—it’s the foundation of a living model. Once the initial structure is in place, you can expand it into a fully functional system model.
First, add entry and exit actions to states. For example, when an order enters the “Picking” state, the system can automatically trigger a warehouse task assignment. When “Delivered” is reached, an email notification is sent to the customer and a fulfillment report is generated.
Second, define guard conditions and events precisely. In the “Picking” state, add a guard condition like “Inventory Available” to prevent picking when stock is low. This ensures the diagram reflects real business logic, not just theory.
Third, link the State Machine Diagram to other models. Create a BPMN process diagram that shows the broader workflow, with the State Machine Diagram embedded as a sub-diagram to represent the order’s lifecycle. This allows for traceability between business processes and system behavior.
Fourth, generate documentation and reports. Use Visual Paradigm’s reporting engine to export the State Machine Diagram with all transitions, conditions, and actions into a PDF or HTML document. This becomes the official reference for training, audits, and system handover.
Finally, enable collaboration. With version control and team workspace features, multiple team members can review, comment, and update the diagram together—ensuring alignment across departments.
Results & Key Takeaways
- Reduced onboarding time for new warehouse and sales staff from 3 days to under 1 hour.
- Eliminated 85% of status-related customer inquiries due to clearer communication.
- Enabled process simulation to identify bottlenecks, reducing order cycle time by 22%.
The transformation was more than just a diagram—it became a shared language. What was once a fragmented, error-prone process is now a transparent, traceable system. The team no longer debates whether an order is “placed” or “paid”—they check the diagram. And because it’s built in a professional modeling tool, they can evolve it as business needs change, without starting from scratch.
Conclusion
Visual Paradigm Desktop combines the speed of AI with the depth of professional modeling—giving you a State Machine Diagram in seconds, and a powerful, living model in minutes. Whether you’re clarifying order lifecycles, designing user flows, or managing complex systems, AI generation is the fastest way to start. Download Visual Paradigm Desktop today and create your first AI-generated diagram in under 60 seconds.