Creating a customer journey map is often seen as a purely qualitative exercise. Teams sketch out emotional highs and lows, touchpoints, and pain points. However, without a clear link to business outcomes, these maps can become beautiful artifacts that gather digital dust. The true value emerges when you align journey mapping with conversion goals. This alignment ensures that every step taken by a user contributes directly to the organization’s strategic objectives.
When experience design and conversion optimization operate in silos, friction increases and revenue stagnates. A user might find the process easy, but if the path does not lead to a desired action, the experience fails the business. Conversely, a conversion-focused funnel that ignores user sentiment creates a transactional relationship that lacks loyalty. The goal is integration. This guide details how to bridge the gap between empathy and efficiency, ensuring that your journey map drives measurable results.
1. The Intersection of Experience and Revenue 💡
Understanding the relationship between journey mapping and conversion goals requires a shift in perspective. It is not enough to track where users click; you must understand why they click. A journey map visualizes the narrative of the customer. A conversion goal defines the destination of that narrative. When these two elements are misaligned, you risk optimizing for the wrong behaviors.
- Experience Focus: Often prioritizes satisfaction, ease of use, and emotional connection.
- Conversion Focus: Prioritizes completion of specific actions, such as purchases, sign-ups, or downloads.
- Aligned Focus: Recognizes that positive experiences drive higher completion rates and long-term retention.
Consider a scenario where a checkout process is simplified to reduce friction. If the user feels rushed or confused by the new flow, satisfaction drops even if the immediate conversion rate spikes. True alignment requires a holistic view where the journey supports the goal without sacrificing the user’s sense of control or value.
2. Defining Conversion Goals Within the Journey 🎯
Before drawing a single line on a map, you must clarify what success looks like. Conversion goals are not always monetary. In many contexts, a conversion is a step toward a larger transaction. Identifying these micro and macro conversions is critical for accurate mapping.
Types of Conversion Goals
Not all actions hold equal weight. Categorizing goals helps prioritize efforts on the journey map.
- Macro Conversions: The primary business outcome. Examples include completing a purchase, booking a consultation, or subscribing to a paid tier.
- Micro Conversions: Sub-goals that indicate progress toward the macro outcome. Examples include adding an item to a cart, signing up for a newsletter, or downloading a whitepaper.
- Negative Conversions: Actions that indicate disengagement. Examples include abandoning a cart, unsubscribing, or leaving a page after 5 seconds.
When mapping the journey, each touchpoint must be evaluated against these goals. Does this interaction move the user closer to a macro conversion? Does it encourage a micro conversion? If a touchpoint serves no purpose in this hierarchy, it may be a source of unnecessary complexity.
3. Step-by-Step Alignment Process 🛠️
Aligning these two distinct frameworks requires a structured approach. Ad hoc adjustments often lead to conflicting priorities. Follow this systematic process to ensure consistency across teams.
- Audit the Current Map: Review existing journey maps. Identify where they focus on emotion versus action. Note where data is missing.
- Define Key Performance Indicators (KPIs): Establish clear metrics for each stage of the journey. Avoid vanity metrics that do not correlate with revenue.
- Map Touchpoints to Stages: Ensure every interaction listed on the map corresponds to a specific stage of the buyer’s journey.
- Identify Friction Points: Look for areas where the emotional journey clashes with the conversion path. For example, a confusing form field might lower frustration but block a sale.
- Validate with Data: Use analytics to confirm if the mapped journey matches actual user behavior. Adjust the map based on real-world evidence.
- Iterate and Optimize: Treat the map as a living document. Update it as goals shift or new behaviors emerge.
4. Mapping Touchpoints to Conversion Stages 📊
The most effective way to visualize this alignment is through a structured table that correlates journey stages with specific conversion objectives. This helps teams see the big picture and identify gaps where the journey stalls.
| Journey Stage | Customer Mindset | Primary Conversion Goal | Key Touchpoints |
|---|---|---|---|
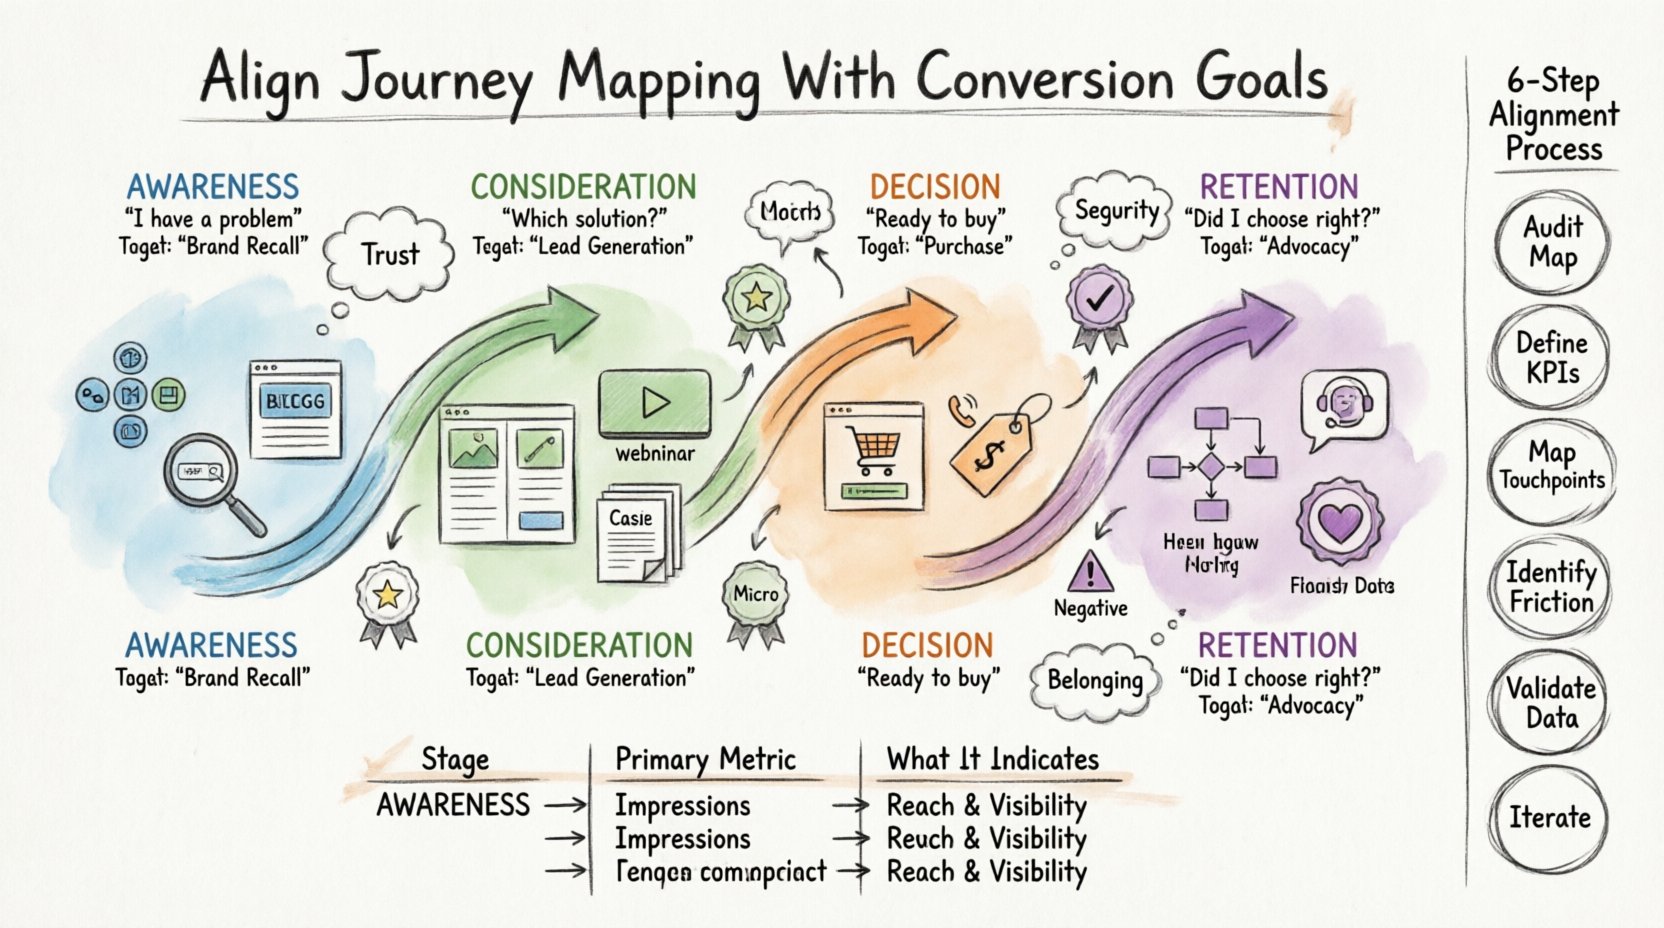
| Awareness | “I have a problem. I need a solution.” | Brand Recall & Traffic | Social Media, Search Ads, Blog Posts |
| Consideration | “Which solution is best for me?” | Lead Generation & Engagement | Comparison Pages, Webinars, Case Studies |
| Decision | “I am ready to buy. Is now the right time?” | Purchase & Sign-up | Checkout Page, Pricing Page, Sales Call |
| Retention | “Did I make the right choice?” | Repeat Purchase & Advocacy | Onboarding Emails, Support Chat, Loyalty Programs |
Notice how the conversion goal evolves. In the Awareness stage, the goal is not to sell but to capture attention. In the Decision stage, the goal shifts to closing the deal. A journey map that tries to sell in the Awareness stage often creates resistance. Aligning the goal to the mindset prevents this friction.
5. Critical Metrics for Alignment 📈
Once the map is aligned, you need to measure its effectiveness. Relying on a single metric, such as total sales, hides the nuances of the journey. You need a dashboard of metrics that reflect performance at each stage.
| Stage | Primary Metric | Secondary Metric | What It Indicates |
|---|---|---|---|
| Awareness | Organic Traffic | Bounce Rate | Are the right people finding you? |
| Consideration | Time on Page | Click-Through Rate (CTR) | Is the content engaging and relevant? |
| Decision | Conversion Rate | Cart Abandonment Rate | Is the path to purchase clear? |
| Retention | Customer Lifetime Value (CLV) | Net Promoter Score (NPS) | Are customers happy and returning? |
These metrics provide the feedback loop necessary for continuous improvement. If the Conversion Rate drops while Traffic remains stable, the issue lies within the journey map itself, likely in the Consideration or Decision stages. If Traffic drops, the Awareness stage needs adjustment.
6. Common Pitfalls and How to Avoid Them ⚠️
Even with a solid plan, teams often stumble during implementation. Recognizing these common errors early can save significant time and resources.
- Assuming Linearity: Users rarely move in a straight line from Awareness to Retention. They loop back, skip steps, or jump ahead. Your map must account for non-linear paths.
- Ignoring Mobile Behavior: Desktop and mobile journeys differ significantly. A form that works on a computer may be unusable on a phone. Map these channels separately or ensure cross-device compatibility.
- Focusing on Internal Goals Only: If the map prioritizes internal data collection over user value, users will feel exploited. Balance business needs with user needs.
- Static Mapping: A map created once and filed away is useless. Markets change, and so do user behaviors. Regular reviews are essential.
- Confusing Activity with Action: Clicking a button is an activity. Completing a task is an action. Do not confuse high activity with high conversion. Focus on the outcome.
7. Iterating for Continuous Improvement 🔄
The alignment between journey and goals is not a one-time project. It is a cycle of testing, learning, and refining. As you gather data, you will find that the map does not perfectly match reality. This is where the real work begins.
The Feedback Loop
Integrate customer feedback directly into the mapping process. Surveys, usability testing, and support tickets provide qualitative data that complements quantitative analytics.
- Collect Feedback: Ask users about their experience at key touchpoints.
- Analyze Discrepancies: Where does the user experience differ from the map?
- Update the Map: Reflect these findings in the journey visualization.
- Test Changes: Implement fixes and measure the impact on conversion goals.
This cycle ensures that your journey map remains a relevant tool for strategy rather than a relic of the past. It also fosters a culture of empathy within the organization, where every decision is weighed against the impact on the customer.
8. Integrating Cross-Channel Consistency 🌐
Modern customers interact with brands across multiple channels. They might see an ad on social media, research on a blog, and buy via a mobile app. A fragmented journey kills conversion. Alignment requires consistency across all these touchpoints.
- Unified Messaging: Ensure the tone and value proposition remain consistent whether the user is on email, web, or in-person.
- Seamless Handoffs: If a user starts a process on one device, allow them to finish on another. Context must be preserved.
- Integrated Data: Use a centralized view of customer data to understand the full path, not just isolated channel performance.
When channels are siloed, the journey map becomes incomplete. You might optimize the email sequence while the mobile experience remains broken. Alignment demands a unified approach where every channel supports the overarching conversion goal.
9. The Role of Emotional Drivers 🧠
While conversion goals are logical, the decisions are emotional. A journey map that ignores emotion will fail to persuade. You must identify the emotional drivers at each stage of the funnel.
- Trust: Critical in the Consideration stage. Users need proof that you are reliable.
- Urgency: Effective in the Decision stage, but must be genuine, not manipulative.
- Security: Essential during the transaction. Users must feel safe sharing data.
- Belonging: Vital for Retention. Users should feel part of a community.
By mapping these emotional states alongside conversion goals, you can design interventions that resonate. For example, adding social proof reviews can build trust and simultaneously increase conversion rates. The emotional and logical goals reinforce each other.
10. Finalizing the Strategy 📝
Bringing journey mapping and conversion goals together is a complex but necessary endeavor. It requires collaboration between design, marketing, analytics, and product teams. No single department owns the customer experience. Shared ownership leads to shared success.
Start by auditing your current state. Identify where the disconnect lies. Apply the step-by-step process outlined above. Use the tables provided to structure your analysis. Measure rigorously. Iterate continuously. By doing so, you transform your journey map from a static diagram into a dynamic engine for growth.
Remember, the goal is not just to move users through a funnel. It is to guide them through an experience that feels natural and valuable. When the journey feels right, the conversion becomes a natural byproduct of a satisfied customer.
Commit to this alignment. Your business will benefit from higher efficiency, and your customers will benefit from a clearer, more helpful path forward.