System design is the backbone of reliable software engineering. Among the various modeling tools available, the UML Interaction Overview Diagram stands out for its ability to map complex workflows without the rigidity of pure sequence diagrams or the abstraction of pure activity diagrams. As we navigate through 2024, the demand for precise documentation has never been higher. Teams require blueprints that developers can read, test, and implement without ambiguity. This guide outlines the essential standards for constructing these diagrams effectively.
🔍 Understanding the Interaction Overview Diagram
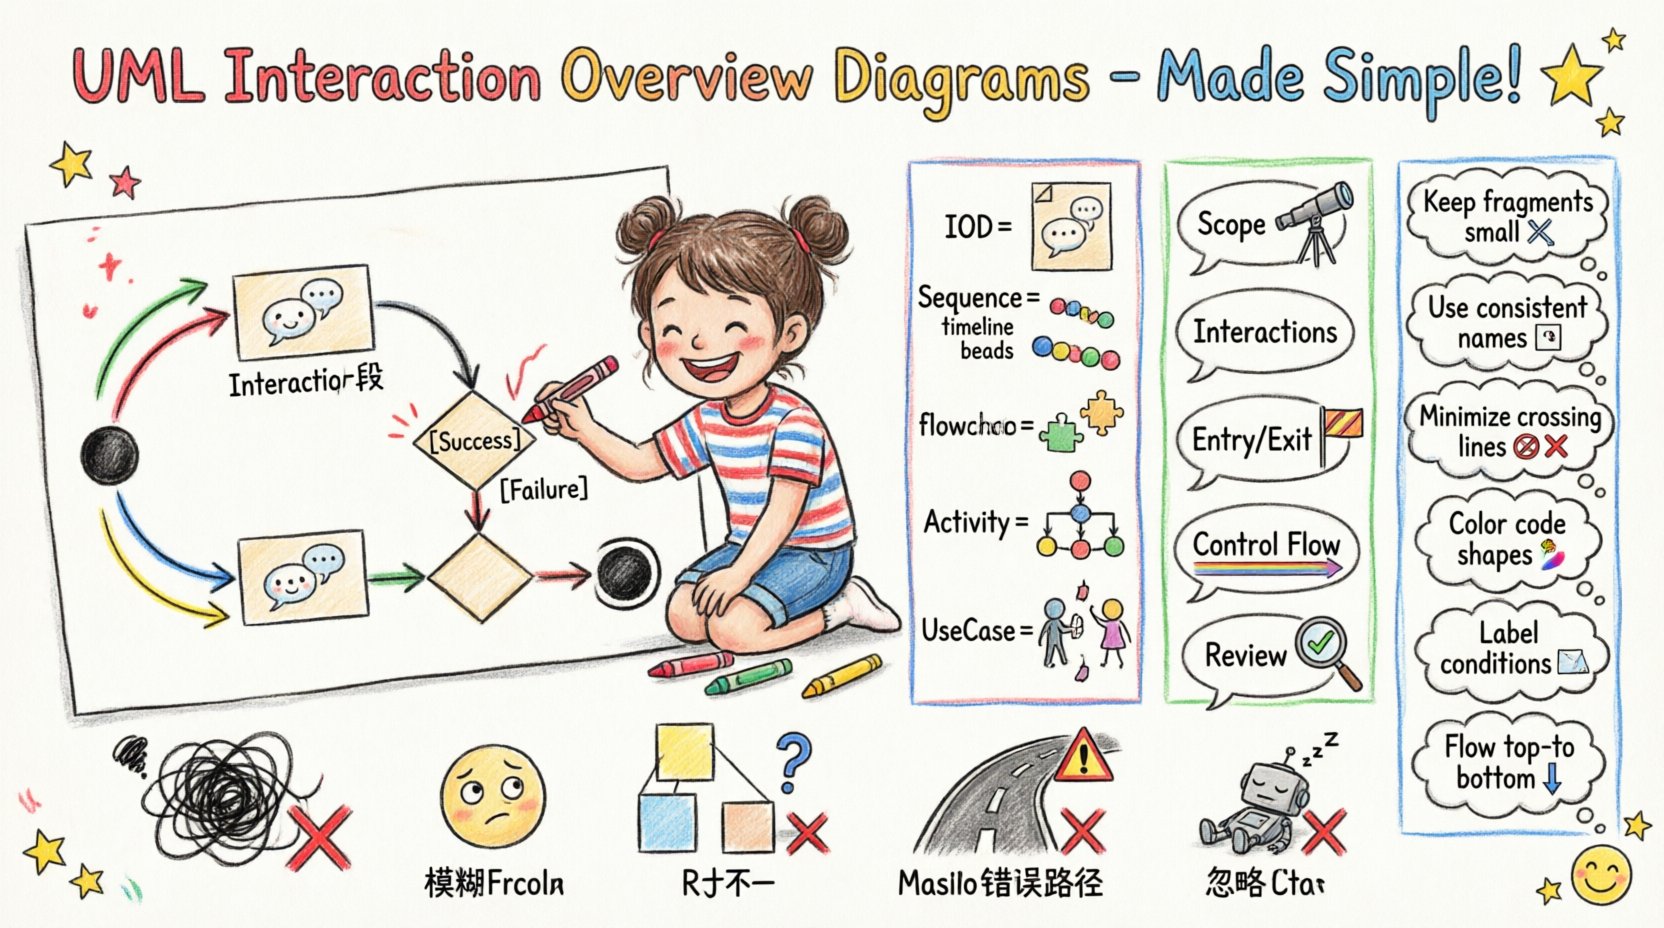
An Interaction Overview Diagram (IOD) is a behavioral diagram that combines elements of activity diagrams and interaction diagrams. It serves as a high-level view of a system’s logic, focusing on the interactions between objects or participants within specific contexts. Unlike a standard activity diagram, which focuses on actions and state changes, an IOD emphasizes the communication flow.
When used correctly, this diagram acts as a bridge between abstract requirements and concrete implementation details. It allows architects to visualize how different parts of a system talk to one another during a specific use case. This is particularly useful when a single sequence diagram becomes too cluttered to manage effectively.
- High-Level Flow: It shows the sequence of interaction fragments.
- Control Flow: It defines how the process moves from one interaction to another.
- Modularity: It allows complex interactions to be broken down into manageable chunks.
🧩 Core Elements and Notation
To create a professional diagram, one must adhere to standard notation. Deviating from these standards creates confusion for anyone reviewing the documentation. The following components form the skeleton of a valid Interaction Overview Diagram.
1. Activity Nodes
These are the circles that represent the start and end points of a flow. They are usually solid black circles for the initial node and a solid black circle with a thick border for the final node.
2. Interaction Fragments
This is the heart of the IOD. An interaction fragment is essentially a miniature interaction diagram embedded within the overview. It represents a specific exchange of messages between objects. These are typically enclosed in a rectangle labeled with a specific operator.
3. Control Edges
These are arrows connecting the activity nodes. They dictate the order of execution. Unlike sequence diagrams, the control edges here determine the flow of the overall process, not just the timing of messages.
4. Decision Nodes
Represented by diamonds, these nodes indicate where the flow branches based on a condition. Every decision node must have at least one incoming edge and two or more outgoing edges, each labeled with a guard condition.
5. Merge Nodes
These are used to combine different paths back into a single flow. They look like diamonds but do not have conditions; they simply merge routes.
📋 When to Use IOD vs. Other Diagrams
Selecting the right tool for the job is critical. Using an Interaction Overview Diagram where a Sequence Diagram would suffice can lead to unnecessary complexity. Conversely, using a Sequence Diagram for a complex branching workflow can make the document unreadable. Use the table below to determine the appropriate choice.
| Diagram Type | Primary Focus | Best Use Case |
|---|---|---|
| Interaction Overview | High-level control flow and interaction sequencing | Complex workflows with multiple interaction scenarios |
| Sequence Diagram | Message timing and object lifelines | Detailed step-by-step communication for a single scenario |
| Activity Diagram | Business logic and state transitions | Algorithmic logic without specific object interactions |
| Use Case Diagram | Actor goals and system boundaries | Functional requirements and user roles |
🛠️ Step-by-Step Creation Process
Creating a robust diagram requires a structured approach. Rushing into drawing symbols without a plan often results in diagrams that are difficult to maintain. Follow this workflow to ensure accuracy.
Step 1: Define the Scope
Identify the specific use case or scenario you are modeling. An IOD should not attempt to model the entire system in one view. Break the system down into logical modules. For example, if modeling a payment process, focus on the payment transaction flow rather than the user login flow unless they are directly linked.
Step 2: Identify Interactions
List the specific interactions required to complete the scenario. These are the “fragments” you will embed in the diagram. Ask yourself: What objects need to talk? What data is exchanged? What are the success and failure paths?
Step 3: Establish Entry and Exit Points
Where does the process begin? Where does it end? Define the initial and final nodes clearly. This anchors the diagram and prevents the flow from looking aimless.
Step 4: Map the Control Flow
Connect the interaction fragments using control edges. Determine the logic for branching. If a step fails, does the process stop, retry, or switch to an alternative path? Document these decisions using decision nodes.
Step 5: Refine and Review
Once the draft is complete, review it against the requirements. Check for dead ends, loops that do not terminate, and unclear paths. Ensure that every decision node has a corresponding merge node if paths are meant to converge.
✅ Best Practices for Clarity and Readability
Clarity is the primary goal of any technical diagram. If a developer cannot understand the diagram within five minutes, the diagram has failed. The following practices will help you maintain high standards.
1. Limit Interaction Fragment Complexity
An interaction fragment should not be a complete sequence diagram. It should represent a concise exchange. If an interaction fragment requires more than 15 lines of vertical space, consider breaking it down into smaller fragments or using a sub-flow. Complex details belong in the detailed sequence diagrams that the IOD references.
2. Use Consistent Naming Conventions
Labels are vital. Use consistent naming for nodes, edges, and fragments. If you call a node “Process Payment” in one section, do not call it “Handle Payment” in another. Consistency reduces cognitive load.
3. Minimize Crossing Lines
Crossing control edges make the diagram look messy and hard to follow. Arrange your activity nodes spatially to minimize intersections. If crossing is unavoidable, use orthogonality (right-angle turns) to keep lines distinct.
4. Leverage Color and Shape Wisely
While this guide avoids CSS, in a visual modeling tool, color can aid understanding. Use specific shapes for different types of nodes. For example, use rounded rectangles for interaction fragments and diamonds for decisions. This visual hierarchy helps the eye distinguish between control logic and interaction data.
5. Document Guard Conditions Explicitly
Decision nodes should always have labeled edges. A diamond with two outgoing lines but no labels is ambiguous. Use guard conditions like [Success], [Failure], or [Timeout]. This makes the logic self-explanatory.
6. Maintain Logical Direction
Flow generally moves from top to bottom or left to right. Avoid loops that force the eye to travel backward or diagonally unless necessary. Consistent directionality aids in reading speed and comprehension.
🚫 Common Pitfalls to Avoid
Even experienced modelers make mistakes. Being aware of common errors can save significant rework time later.
- Over-Modeling: Trying to show every single message exchange in the overview. Remember, the IOD is an overview, not a detail view.
- Unclear Loops: Creating loops without a clear exit condition. Infinite loops in diagrams suggest infinite loops in code, which is a critical risk.
- Inconsistent Granularity: Mixing high-level activity nodes with detailed sequence diagrams in the same fragment. Keep the level of abstraction consistent.
- Missing Error Handling: Showing only the happy path. Real-world systems must handle exceptions. Ensure failure paths are modeled and documented.
- Ignoring State: Failing to account for the state of objects between interactions. If an object’s state changes significantly, ensure the diagram reflects that context.
🔄 Maintenance and Evolution
Software is dynamic. Requirements change, and systems evolve. An Interaction Overview Diagram is not a static artifact; it is a living document that must grow with the system. Here is how to keep it relevant.
1. Version Control Integration
Store your diagram definitions alongside your code. When a feature changes, the diagram should be updated as part of the same commit. This ensures traceability between the code and the design.
2. Regular Audits
Schedule quarterly reviews of your diagrams. Are the interactions still accurate? Have new nodes been added that break the layout? Remove obsolete paths that no longer exist in the production system.
3. Linking to Specifications
Connect the diagram to requirement documents. If a requirement changes, the diagram should reflect that change immediately. This linkage ensures that the visual model remains a true representation of the system’s behavior.
🧠 Cognitive Load Considerations
Designing diagrams is also a psychological exercise. You are designing for the human brain. The human brain has limits on how much information it can process at once. This concept is known as cognitive load.
- Chunking: Group related interactions together. Do not scatter fragments randomly across the canvas. Use containers or sub-diagrams to group logical sections.
- White Space: Do not cram elements together. Adequate spacing allows the eye to rest and process information in sections.
- Visual Hierarchy: Make the most important paths visually prominent. Use line thickness or position to indicate priority.
📈 Integrating with Modern Workflows
In 2024, diagrams are often part of a broader DevOps or Agile ecosystem. They are not just for documentation; they are for automation and communication.
1. Communication Hub
Use the IOD as a communication tool during sprint planning. It allows stakeholders to understand the flow of data without needing to read the code. This alignment reduces the gap between business and technical teams.
2. Test Case Generation
The paths defined in the diagram can serve as a basis for test case generation. Each edge represents a potential path through the system. Testers can verify that every branch in the decision nodes is covered.
3. Architecture Reviews
During architecture reviews, the IOD provides a quick snapshot of system complexity. It helps architects identify bottlenecks, such as too many sequential interactions where parallel processing might be better.
❓ Frequently Asked Questions
Q: Can I use an Interaction Overview Diagram for real-time systems?
Yes, but with caution. Real-time systems have strict timing constraints. While an IOD shows flow, it does not explicitly show timing. You may need to supplement it with timing diagrams if latency is a critical factor.
Q: How do I handle asynchronous interactions?
Use the appropriate interaction fragment notation for asynchronous messages. The control flow should account for the delay. Ensure the decision nodes reflect the wait states or timeouts associated with asynchronous calls.
Q: Is it better to use one large diagram or many small ones?
Many small ones. A single diagram with more than 20 nodes becomes difficult to navigate. Use a master IOD to link to several sub-iods for detailed sections. This modular approach improves maintainability.
Q: What if the workflow changes frequently?
If the workflow changes frequently, the diagram might be a liability. Consider using lighter-weight documentation methods or ensuring your modeling tool supports rapid iteration. The cost of maintaining the diagram must not exceed the value it provides.
🏁 Final Thoughts
Creating clear and actionable UML Interaction Overview Diagrams is a skill that improves with practice and adherence to standards. By focusing on clarity, maintaining consistent notation, and understanding the cognitive needs of the reader, you can produce diagrams that add genuine value to your project. These diagrams are not just drawings; they are contracts between the design and the implementation. Treat them with the care they deserve, and your system architecture will benefit from the resulting precision and understanding.
Remember, the goal is not to create a perfect diagram for the sake of perfection, but to create a useful tool that aids in the development process. Keep it simple, keep it accurate, and keep it updated.