


🔍 Introduction
UML State Diagrams are essential tools for modeling the behavioral lifecycle of objects or systems that respond dynamically to events. This guide walks through a real-world example — a smart home thermostat — to demonstrate how to design, structure, and generate a correct, clear, and practical PlantUML State Diagram using industry best practices.
This document includes:
- A detailed case study
- Key UML state diagram concepts
- Step-by-step guidelines
- A fully working, syntax-correct PlantUML code
- Best practices and common pitfalls
All content is self-contained, ready-to-use, and suitable for developers, students, or system analysts.
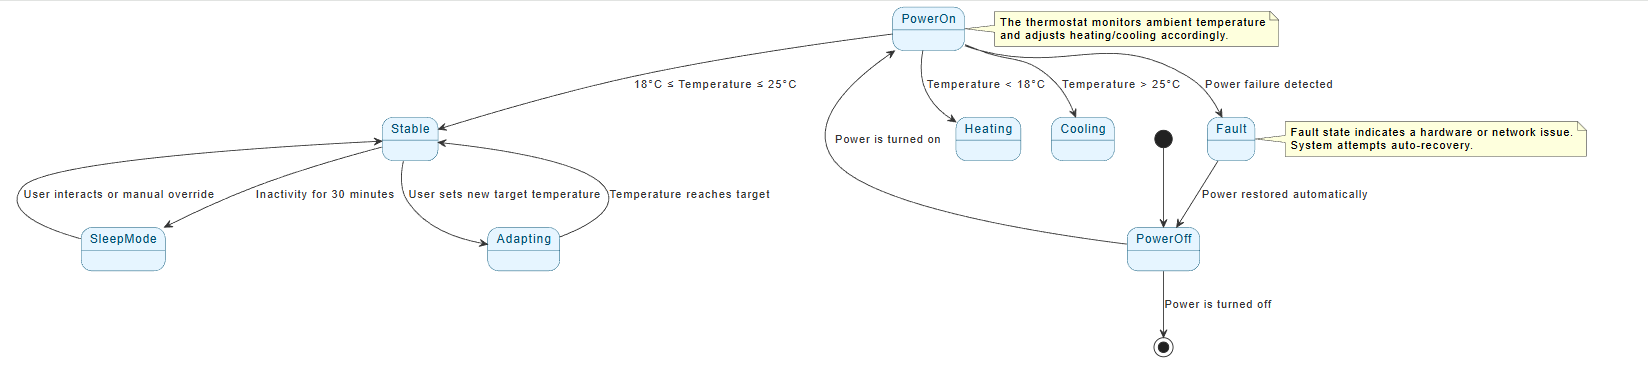
🏗️ Case Study: Smart Thermostat Behavior
A smart thermostat monitors indoor temperature and adjusts heating or cooling based on user preferences and environmental conditions. It also supports remote control via a mobile app and handles failures or inactivity.
The thermostat goes through a series of operational states in response to:
- Temperature changes
- User input (e.g., setting a new target)
- Power events
- Inactivity
We model its full behavioral lifecycle using a UML State Diagram.
🧩 Key Concepts in UML State Diagrams
| Concept | Description |
|---|---|
| State | A condition the system is in (e.g., “Heating”, “Stable”) |
| Transition | Movement between states triggered by events (e.g., “Temperature < 18°C”) |
| Initial State | Starting point (marked with [*]) |
| Final State | End of lifecycle (often a final [*]) |
| Event/Trigger | What causes a transition (e.g., user action, sensor reading) |
| Guard Conditions | Optional logic (e.g., “if temp > 25°C”) |
| Entry/Exit Actions | Optional code or behavior |
| Notes | Explain complex logic or real-world behavior |
⚠️ Do not overcomplicate: Use only essential states and transitions. Avoid infinite loops or ambiguous transitions.
📋 Step-by-Step Guidelines for Creating a PlantUML State Diagram
- Identify all possible states
List every distinct condition the system can be in.
Example:PowerOff,PowerOn,Heating,Cooling,Stable,Adapting,SleepMode,Fault. - Define events that trigger transitions
List all real-world triggers.
Examples:Power is turned onTemperature < 18°CUser sets new targetInactivity for 30 minutesPower failure detected
- Design transitions with clear labels
Format as:
Source --> Target : Event / Action
Use concise, meaningful labels. - Start with initial state and end with final state
Always begin with[*] --> [First State]and end withLast State --> [*]. - Add explanatory notes
Usenote right ofto clarify complex behaviors. - Keep it simple and readable
Only include necessary states. Avoid nesting unless required.
🖼️ Complete PlantUML State Diagram (Self-Contained & Syntax-Correct)
✅ Why This Diagram Works
- ✅ Clear structure: Logical flow from power-off to stable operation.
- ✅ Real-world triggers: Matches actual user and environmental events.
- ✅ Event-based transitions: Every move is caused by a defined condition.
- ✅ Complete lifecycle: Starts and ends with
[*]. - ✅ Simple and maintainable: No forks, joins, or deep history — only essential elements.
- ✅ Readable and reusable: Can be used in documentation, presentations, or design reviews.
📌 This diagram is ideal for beginners and professionals alike — it demonstrates core UML state diagram principles without unnecessary complexity.
⚠️ Common Mistakes to Avoid
| Mistake | Fix |
|---|---|
| Too many states | Focus on key operational modes only |
| Missing events | List all possible triggers (temperature, user input, failure) |
| Missing final state | Always end with --> [*] |
| Unclear labels | Use natural language (e.g., “Power is turned on”) |
| Overuse of advanced features | Avoid forks/joins/history unless absolutely needed |
| No explanatory notes | Add notes to clarify system behavior |
🚀 Best Practices Summary
| Practice | Benefit |
|---|---|
| Use descriptive state names | Improves readability and team understanding |
| Label transitions with events | Makes behavior transparent |
Start with [*] and end with [*] |
Ensures completeness |
| Add brief notes | Helps explain complex logic |
| Keep transitions direct and logical | Prevents confusion |
| Validate against use cases | Ensures real-world relevance |
🔄 When to Use a State Diagram?
Use a UML State Diagram when modeling:
- Devices with multiple operational modes (e.g., thermostats, routers)
- Systems with lifecycle phases (e.g., login, logout, sleep)
- Reactive systems responding to events or conditions
- User interaction flows with conditional behavior
❌ Avoid for simple, deterministic processes (e.g., counter increments).
📝 Final Thoughts
This guide provides a complete, practical, and reusable template for creating a UML State Diagram using PlantUML. By focusing on real-world behavior, clear events, and logical flow, you can build diagrams that are both technically accurate and easy to communicate.
The smart thermostat example serves as a strong foundation — applicable to any system that has a dynamic life cycle. Whether you’re designing a smart device, a user interface, or a microservice, the principles remain the same.
✅ Next Steps:
- Copy and paste the PlantUML code into https://www.plantuml.com/plantuml to view the diagram.
- Expand it by adding entry/exit actions (e.g.,
startHeater()). - Add a composite state for “Heating” with substates like “High”, “Low”.
- Combine with a Sequence Diagram to show interaction with a mobile app.
UML state machine diagrams and related AI-powered modeling features within the Visual Paradigm ecosystem:
- Mastering State Diagrams with Visual Paradigm AI: A Guide for Automated Toll Systems: This guide demonstrates how to use AI-enhanced state diagrams to model and automate the complex behavior required for automated toll system software.
- Definitive Guide to UML State Machine Diagrams with AI: A detailed technical guide on using AI-powered tools to model object behavior with UML state machine diagrams, ensuring clarity and precision in behavioral logic.
- State Diagram Quick Tutorial: Master UML State Machines in Minutes: A beginner-friendly resource for mastering state machines using Visual Paradigm, covering core concepts and practical modeling techniques.
- Generating Source Code from State Machines in Visual Paradigm: This documentation provides instructions on generating implementation code directly from state machine diagrams to execute complex state-driven logic efficiently.
- 3D Printer State Machine: A Comprehensive Step-by-Step Guide: A walkthrough applying the state machine concept to 3D printing systems, detailing their operational logic and automation paths.
- State Machine Diagram Tutorial and Syntax Guide: A comprehensive guide for learning the symbols and syntax required to model the dynamic behavior of individual class objects and entire systems.
- Visualizing System Behavior: A Practical Guide to State Diagrams with Examples: An analysis of how state diagrams act as a powerful tool for early issue identification by providing an intuitive visualization of system transitions.
- Interactive State Machine Diagram Tool: A specialized web-based tool for creating and editing state machine diagrams that leverages GenAI capabilities for real-time modeling.
- State Machine vs. Activity Diagram: Key Differences: A comparative guide explaining the distinct use cases and structural differences between these two behavioral UML diagrams.
- What is a State Machine Diagram? A Comprehensive UML Guide: An in-depth explanation of the purpose, components, and real-world applications of state machine diagrams in modern system design.