Traditional customer journey mapping often prioritizes empathy and emotion over tangible business outcomes. While understanding how a user feels is valuable, it does not guarantee revenue. A conversion-focused approach shifts the lens from pure experience to measurable action. This method aligns every touchpoint with the primary goal of guiding the user toward a specific conversion event, whether that is a purchase, a sign-up, or a lead generation form submission. By integrating conversion optimization principles into the mapping process, organizations can create a roadmap that serves both the customer and the business bottom line. This guide explores how to build maps that drive results without losing sight of the human element.
Why Standard Mapping Often Misses the Mark 📉
Many teams create journey maps that look beautiful but lack strategic utility. These maps frequently highlight emotional highs and lows but fail to identify where the revenue leak occurs. When a journey map is created solely for brand awareness, it may ignore critical friction points that happen at the decision-making stage. For instance, a user might love the brand image (high satisfaction) but encounter a confusing checkout process (low conversion). A standard map might note the “confusion” but not quantify its impact on lost sales.
Key issues with non-conversion-focused maps include:
- Lack of Data Integration: Relying on assumptions rather than behavioral data.
- Stage Agnosticism: Treating all stages equally without weighting them by conversion probability.
- Missing Metrics: No clear definition of success for each step of the map.
- Static Nature: Creating a map once and leaving it unchanged for years.
To correct this, the mapping process must begin with the end goal in mind. Every action, interaction, and information gap must be evaluated based on its contribution to the final conversion. This does not mean ignoring user experience; it means ensuring the experience facilitates the transaction.
Foundational Elements of a Conversion Map 🧱
Building a map designed for conversion requires specific inputs and outputs. It is not just a visual diagram; it is a strategic document that informs design, copy, and technical implementation.
1. Defining the Conversion Event
Before drawing a single line, you must define what success looks like. Is it a completed purchase? Is it a demo request? Is it a subscription? Ambiguity here leads to a map that is too broad to be useful. Once defined, the map should reverse-engineer the steps required to reach that event.
2. Identifying the Persona and Intent
Not all users want the same thing. A map should be built for a specific persona with a specific intent. A user searching for “how to fix a leak” has different intent than someone searching for “best plumber near me.” The former is informational; the latter is transactional. Your map must account for these distinct pathways.
3. Mapping the Touchpoints
A touchpoint is any interaction a user has with your brand. In a conversion context, these are the moments where you can influence the outcome. Common touchpoints include:
- Social media posts
- Search engine results
- Website landing pages
- Email newsletters
- Customer support interactions
- Product packaging
Each touchpoint must be evaluated for its ability to move the user forward. If a touchpoint adds noise without clarity, it should be removed or redesigned.
The Step-by-Step Mapping Process 🛠️
Executing a conversion-focused map requires a disciplined approach. The following steps ensure that the final artifact is actionable and data-backed.
Step 1: Data Collection and Analysis
Do not rely on intuition. Start with quantitative data to understand what is happening and qualitative data to understand why. Combine traffic analytics with user interviews to get a full picture.
- Behavioral Data: Where do users drop off? Which pages have high bounce rates?
- Survey Data: What are users saying about their experience? What obstacles did they mention?
- Support Tickets: What are the most common complaints? These often highlight friction points.
Step 2: Visualizing the Current State
Draw the journey as it exists today. Include every channel and interaction. This is often called the “Current State Map.” Be honest about inefficiencies. If a user has to call support to complete a task they could do online, mark that as a friction point immediately.
Step 3: Identifying Friction Points
Friction is anything that slows down or stops the user. In a conversion map, friction is the enemy. You need to categorize friction to address it effectively.
Step 4: Designing the Future State
Once friction is identified, sketch the ideal path. This “Future State Map” removes barriers and optimizes the flow. The goal is to reduce the number of clicks and the cognitive load required to convert.
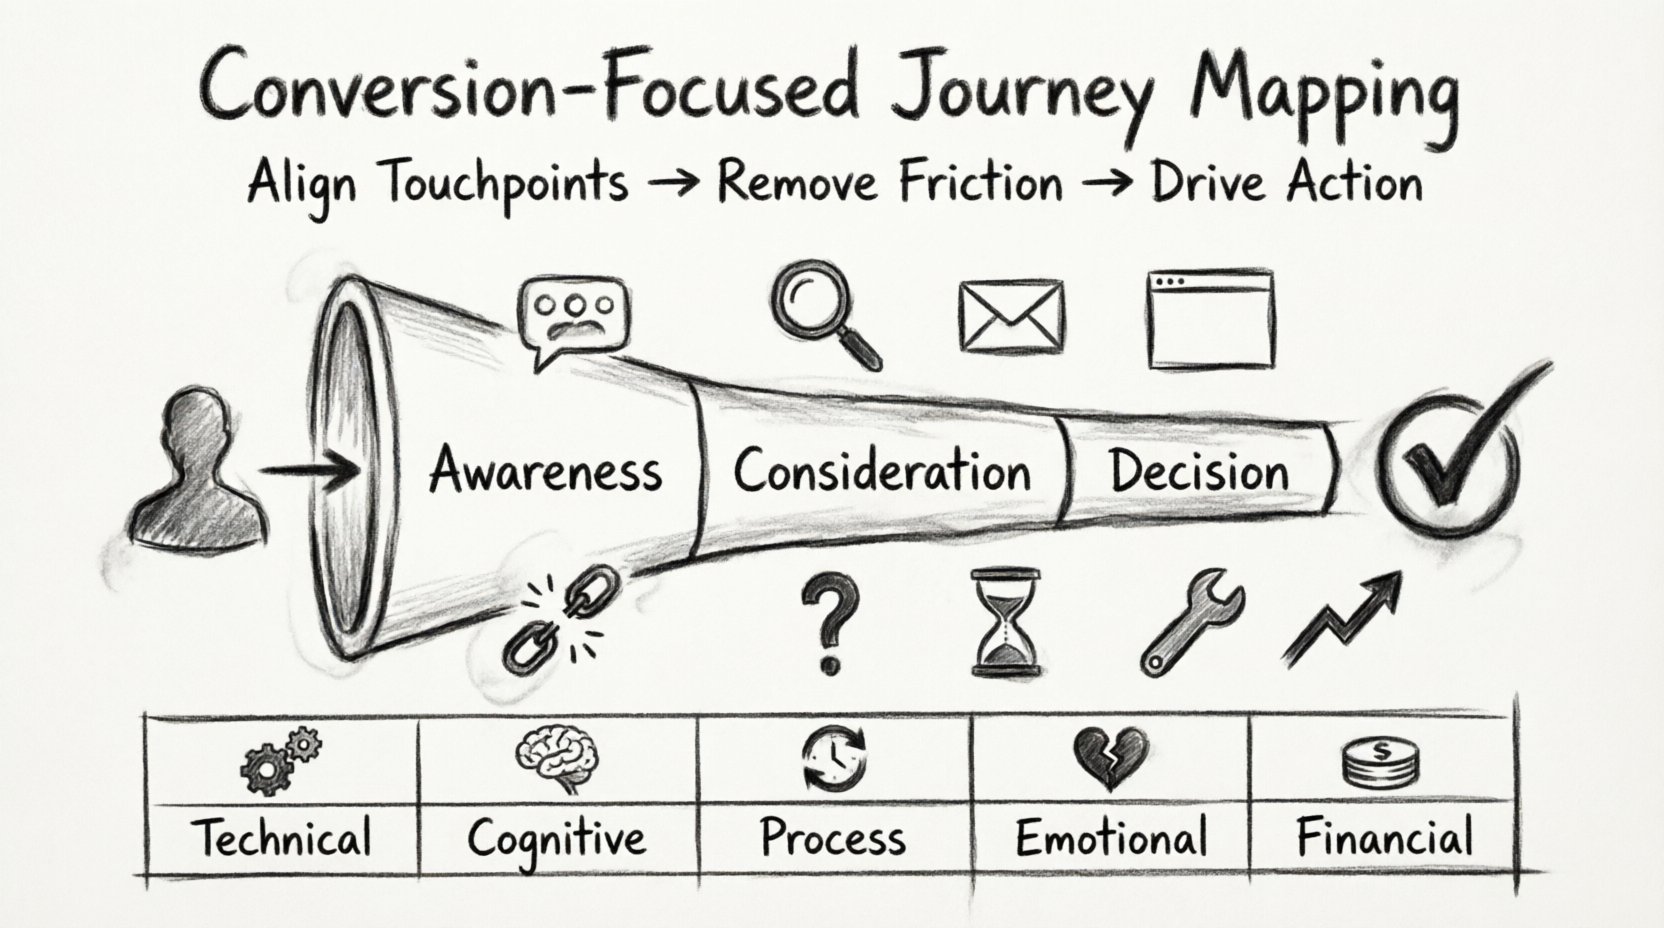
Categorizing Friction Points for Analysis 📊
To make friction actionable, it helps to categorize it. Not all friction is created equal. Some is intentional (like a security check), while some is accidental (like a broken link). Use the table below to analyze friction points during your mapping session.
| Friction Type | Description | Example | Potential Impact |
|---|---|---|---|
| Technical | Issues related to site performance or functionality. | Page load time over 3 seconds. | High abandonment rate. |
| Cognitive | Mental effort required to understand the content. | Unclear pricing tiers or jargon. | Confusion and exit. |
| Process | Steps required that feel unnecessary. | Forced account creation before checkout. | Cart abandonment. |
| Emotional | Feelings of distrust or anxiety. | Lack of security badges or reviews. | Loss of trust. |
| Financial | Perceived cost or risk. | Hidden shipping fees at the end. | Purchase rejection. |
Optimization Strategies for Each Stage 🚀
Once the map is drawn and friction is identified, you can apply specific optimization strategies. These strategies vary depending on the stage of the funnel.
Top of Funnel (Awareness)
The goal here is relevance. Users are looking for answers. Ensure your content matches their search intent perfectly. If they are looking for “budget software,” do not send them to a “premium enterprise solution” landing page. Mismatched messaging creates immediate cognitive friction.
- Align ad copy with landing page headlines.
- Use clear calls to action that promise value.
- Ensure mobile responsiveness immediately.
Middle of Funnel (Consideration)
Users are comparing options. They need trust and proof. This stage of the map should focus on social proof and detailed information. Reduce the need for them to look elsewhere for validation.
- Integrate case studies and testimonials.
- Provide comparison guides.
- Offer live chat support for questions.
Bottom of Funnel (Decision)
This is the critical moment. Friction here is most damaging. The path must be as smooth as possible. Remove distractions that compete with the primary goal.
- Simplify the checkout form to essential fields only.
- Offer multiple payment options.
- Display security assurances prominently.
- Remove navigation links that lead away from the checkout.
Measuring Success and Iteration 📈
A journey map is a living document. It requires constant updating based on performance data. Without measurement, optimization is guesswork. You must establish key performance indicators (KPIs) for each stage of the map.
Key Metrics to Track
- Conversion Rate: The percentage of users who complete the goal.
- Bounce Rate: The percentage of users who leave after one page.
- Time on Page: Indicates engagement level.
- Exit Rate: Where are users leaving the site?
- Task Success Rate: Can users complete the specific task without assistance?
The Feedback Loop
After implementing changes, measure the impact. Did the friction removal increase conversion? If the data shows no change, revisit the map. Was the friction point misidentified? Was the solution ineffective? This cycle of mapping, acting, and measuring is the core of a conversion-focused strategy.
Common Pitfalls to Avoid 🚫
Even with a solid plan, teams often stumble during execution. Being aware of these common errors can save time and resources.
1. Over-Optimizing for the Wrong Metric
Focusing solely on click-through rates can lead to misleading results. You might get more clicks, but if those users don’t convert, the metric is vanity. Focus on the final business outcome, not intermediate vanity metrics.
2. Ignoring Mobile Users
A significant portion of traffic comes from mobile devices. If your map does not account for small screens and touch interactions, you are ignoring a massive segment of your audience. Ensure the journey works seamlessly on smartphones.
3. Siloed Departments
Marketing, sales, and support often work in isolation. A user might have a great experience with marketing ads but a terrible experience with support. This breaks the journey. Cross-functional collaboration is essential to maintain consistency across all touchpoints.
4. Static Mapping
Market conditions change. User behavior changes. A map created six months ago may be obsolete. Schedule regular reviews to ensure the map reflects current realities.
Integrating with Broader Strategy 🤝
Conversion-focused journey mapping should not exist in a vacuum. It must integrate with the broader organizational strategy. This includes product development, content strategy, and customer service policies.
Alignment with Product Roadmap
If the journey map identifies a need for a specific feature to reduce friction, that feature should be prioritized in the product roadmap. The map acts as a voice for the customer within the product team.
Content Strategy Alignment
Content must support the journey. If the map shows users need educational content at the consideration stage, the content team must produce that material. If the map shows users need trust signals, the content team must highlight those.
Cross-Channel Consistency
The message should be consistent whether the user is on social media, email, or the website. Inconsistency creates confusion and increases friction. Ensure brand voice and visual identity are uniform across the journey.
Final Considerations for Implementation ✅
Implementing a conversion-focused approach requires patience and discipline. It is not a quick fix but a strategic shift. Start small. Pick one critical journey, such as the checkout process or the lead capture flow. Map it, find the friction, and optimize it. Once that is successful, expand to other areas of the business.
Remember that the customer is at the center of the map. Optimization should not feel manipulative. It should feel like removing obstacles so the customer can easily find what they need. When friction is removed, conversion rates naturally rise because the path is clearer.
By combining empathy with data, and experience with action, you create a journey map that drives real value. This approach ensures that every touchpoint is working toward the same goal: a satisfied customer who completes their intended action. Keep testing, keep learning, and keep refining the map as the business evolves.