Organizations often focus heavily on acquisition, yet the true cost of growth lies in the friction experienced after the first click. When customers navigate your services, every unnecessary step represents a loss of value. This concept, known as waste, drains resources and erodes trust. To build a resilient experience, you must identify where effort is spent without delivering value. This guide details how to map, analyze, and remove inefficiencies from the customer lifecycle.
Waste in this context is not merely financial loss. It encompasses time, cognitive load, and emotional energy. By applying lean principles to customer journey mapping, teams can create smoother paths that benefit both the user and the business. The following sections outline a systematic approach to finding and fixing these issues.
Understanding Waste Types in Customer Experience 🧩
To eliminate waste, you must first define what it looks like in your specific environment. Originating from manufacturing, lean methodology identifies specific categories of inefficiency. When adapted for service and digital interactions, these categories reveal hidden costs.
Below is a breakdown of common waste types found in customer journeys:
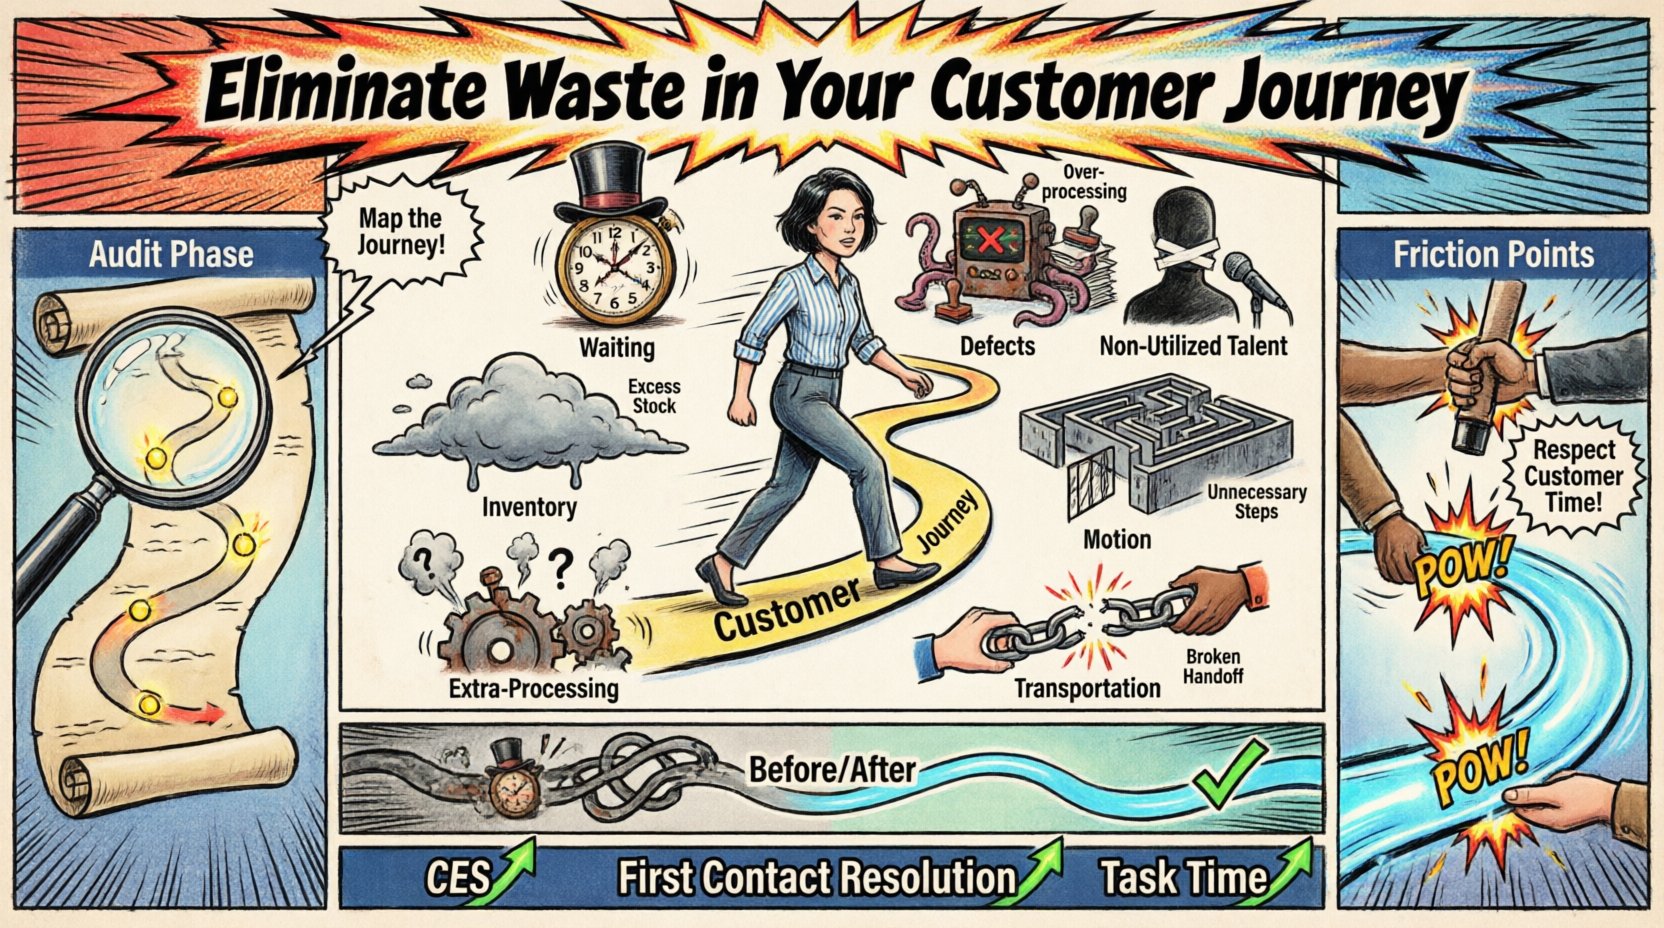
- Waiting: Delays caused by slow response times, loading screens, or manual approval processes.
- Over-processing: Asking for information the company already possesses, or redundant data entry fields.
- Defects: Errors in delivery, broken links, or incorrect billing information that require correction.
- Non-Utilized Talent: Failing to leverage customer feedback or internal employee insights to improve processes.
- Inventory: Accumulating unrequested emails, notifications, or digital clutter that confuses the user.
- Motion: Unnecessary navigation clicks, searching through menus, or scrolling past irrelevant content.
- Extra-Processing: Creating features or reports that no one uses or understands.
- Transportation: Shuffling data between departments where handoffs cause confusion or data loss.
Recognizing these patterns requires a shift in perspective. You are not just looking for broken buttons; you are looking for broken flows. The table below summarizes how these translate into measurable customer pain points.
| Waste Type | CX Manifestation | Impact Metric |
|---|---|---|
| Waiting | Long hold times, slow page loads | Abandonment Rate |
| Over-processing | Complex forms, mandatory account creation | Conversion Rate |
| Defects | Wrong products, technical glitches | Return Rate / Support Tickets |
| Motion | Deep menu structures, confusing navigation | Time on Task |
The Audit Phase: Seeing the Map 🗺️
Before removing waste, you must visualize the current state. This process is often called a “Current State Map.” It documents every touchpoint, action, and emotion the customer encounters. Without this baseline, improvements are guesses rather than strategies.
Conducting a thorough audit involves several steps:
- Map the Path: Document the journey from awareness to retention. Do not assume the path is linear. Customers often loop back or skip steps.
- Identify Channels: Determine where interactions happen. Is it social media, email, phone, or in-person? Each channel introduces different risks.
- Track Handoffs: Note where the customer moves from one department to another. These transitions are common locations for information loss.
- Gather Emotional Data: Record how the customer feels at each stage. Frustration often hides behind silence.
- Collect Quantitative Data: Use analytics to see where users drop off. High bounce rates indicate friction.
This phase requires cross-functional collaboration. Marketing, sales, support, and product teams often hold different pieces of the puzzle. Bringing them together ensures a complete picture. Silos create blind spots where waste thrives.
Identifying Friction Points 🔍
Friction is the resistance a customer feels while trying to achieve a goal. High friction leads to abandonment. Low friction encourages completion. Distinguishing between necessary friction (security) and unnecessary friction (complexity) is vital.
Common areas where friction accumulates include:
- Onboarding: Is the initial setup too complicated? Are instructions clear?
- Search: Can users find what they need quickly? Poor search functionality forces users to guess.
- Checkout: Are there hidden fees? Is the payment process seamless?
- Support: Is self-service available? Does the support agent have the right context?
- Communication: Are messages timely and relevant? Spam reduces trust.
When analyzing friction, look for the “Why.” Why did the customer pause? Why did they drop out? Why did they contact support? Often, the answer lies in a mismatch between expectation and reality.
Operational Inefficiencies 🏭
Customer experience is often a mirror of internal operations. If your backend is slow, the front end will feel slow. If your teams are disconnected, the customer will feel confused. Addressing internal waste is a prerequisite for external improvement.
Consider these operational bottlenecks:
- Manual Data Entry: Transferring data from one system to another creates errors and delays.
- Approval Layers: Too many sign-offs slow down decision-making and customer responses.
- Outdated Systems: Legacy technology often lacks the flexibility needed for modern customer expectations.
- Policy Rigidity: Strict rules that do not account for unique customer situations create frustration.
Solving these issues requires breaking down internal silos. Cross-training staff helps them understand how their role affects the customer. Automation can handle repetitive tasks, allowing humans to focus on complex problems.
Emotional Friction 😔
Not all waste is visible. Emotional waste is the mental energy spent trying to understand a process or navigate a difficult situation. This is often more damaging than technical errors because it affects brand perception.
Signs of emotional waste include:
- Confusion: The customer does not know what to do next.
- Uncertainty: The customer is unsure if their action was successful.
- Impatience: The customer feels their time is not valued.
- Exhaustion: The customer feels tired from the effort required to interact.
To reduce emotional waste, design for clarity. Use plain language instead of jargon. Provide progress indicators so users know where they stand. Anticipate questions and answer them before they are asked.
Strategies for Streamlining 🛠️
Once waste is identified, the focus shifts to elimination. This does not mean cutting corners; it means removing steps that do not add value. The goal is efficiency, not speed alone.
Effective strategies include:
- Radical Simplification: Review every form and button. Ask if it is essential. If not, remove it.
- Personalization: Show customers what they need based on their history. Generic experiences feel wasteful.
- Self-Service Options: Empower users to solve problems without human intervention. Knowledge bases and chatbots can handle routine queries.
- Unified Views: Ensure all teams see the same customer data. Context switching causes errors.
- Feedback Integration: Act on customer feedback quickly. Ignoring input signals that the customer does not matter.
Testing is essential during this phase. A/B testing allows you to compare changes without disrupting the whole system. Small, incremental improvements often yield better long-term results than massive overhauls.
Measuring Efficiency Gains 📈
You cannot manage what you do not measure. After implementing changes, track metrics that reflect waste reduction. Traditional metrics like revenue are important, but operational metrics show efficiency.
Key performance indicators to monitor:
- Customer Effort Score (CES): Measures how much work a customer had to do.
- First Contact Resolution: Indicates if the first interaction solved the problem.
- Task Completion Time: How long it takes to finish a core action.
- Support Ticket Volume: A drop in tickets often means the self-service options are working.
- Churn Rate: Reducing friction should stabilize retention.
Regular reporting keeps the team aligned. Dashboards should highlight trends over time. If a metric worsens, investigate immediately. Continuous monitoring prevents waste from creeping back in.
Common Pitfalls to Avoid ⚠️
Even with the best intentions, teams can make mistakes during optimization. Being aware of these traps helps maintain progress.
- Optimizing for the Wrong Goal: Focusing on speed rather than quality can degrade the experience.
- Ignoring Edge Cases: Solving for the average user often breaks things for the minority. Ensure accessibility and inclusivity.
- Over-Automating: Removing human touchpoints entirely can make customers feel isolated. Balance automation with empathy.
- Stagnation: Treating the map as a one-time project. The journey changes as the business grows.
Another common error is assuming that all data is accurate. Internal reports may not match reality. Always validate data with direct customer feedback.
Building a Culture of Efficiency 🔄
Sustainable improvement requires cultural change. Every employee should feel responsible for the customer experience. Waste reduction is not just a task for the operations team; it is a mindset for the whole organization.
Encourage this culture through:
- Training: Teach staff about lean principles and customer empathy.
- Incentives: Reward teams for identifying and fixing friction.
- Communication: Share success stories and lessons learned across departments.
- Customer Voice: Bring customer feedback directly to team meetings. Hearing complaints firsthand drives action.
When efficiency becomes part of the values, waste reduction happens naturally. Employees will spot inefficiencies in their daily work and suggest fixes.
The Long-Term View 🌱
Eliminating waste is not a destination; it is a continuous practice. Markets change, technologies evolve, and customer expectations shift. A journey map that is accurate today may be outdated in six months.
Commit to a cycle of review and refresh. Schedule regular audits of your journey. Revisit your assumptions. Ask if the current processes still serve the customer. This agility ensures your organization remains competitive and responsive.
By systematically removing waste, you create an experience that respects the customer’s time and attention. This builds loyalty and trust, which are the foundations of lasting growth. The path forward is clear: map the journey, identify the friction, and remove the unnecessary.