In the complex ecosystem of digital marketing and sales, few metrics are as critical yet misunderstood as the conversion funnel. Organizations invest significant resources into attracting prospects, yet a common issue persists: revenue leaks. These leaks occur when potential customers drop off at various stages, moving from awareness to purchase without completing the intended action. This phenomenon is not merely a numbers game; it is a reflection of friction, confusion, or misalignment within the customer experience.
Addressing funnel leakage requires more than just tweaking a button color or adjusting ad spend. It demands a deep dive into the actual path a user takes. This is where journey data becomes indispensable. By analyzing the specific touchpoints, behaviors, and interactions that lead to drop-offs, teams can identify the root causes of leakage and implement targeted fixes. This guide explores how to leverage journey data to diagnose and repair a leaky funnel, ensuring that every stage of the customer lifecycle supports retention and conversion.
Understanding Funnel Leakage 🔍
A funnel represents the theoretical journey of a user from first interaction to final transaction. However, in practice, this path is rarely linear. Leakage refers to the percentage of users who exit the process at any given stage. While some drop-off is natural and expected, excessive leakage at specific points indicates a breakdown in the experience.
To effectively manage this, one must first understand the mechanics of a leaky funnel.
- Quantitative Drop-offs: These are visible in analytics dashboards. If 1,000 users land on a landing page but only 100 fill out a form, the drop-off is 90%.
- Qualitative Friction: This is the reason behind the numbers. Users might be confused by the copy, the form might be too long, or the value proposition might not resonate.
- Technical Failures: Broken links, slow load times, or mobile incompatibility can cause users to abandon the process instantly.
Ignoring these signals leads to wasted budget and diminished return on investment. Fixing the leak is not about forcing users through the funnel; it is about smoothing the path so that the journey feels natural and logical.
The Diagnostic Power of Journey Data 🗺️
Journey data encompasses the collection of information regarding every interaction a user has with a brand across various channels. Unlike standard funnel analytics which often show a single path, journey data reveals the complexity of user behavior. It answers questions like: Did they visit the pricing page before signing up? Did they abandon a cart after seeing a shipping cost? Did they engage with support before converting?
Utilizing this data provides a holistic view of the customer experience. It shifts the focus from isolated metrics to connected behaviors.
Key Components of Journey Data
- Touchpoints: Every instance of contact, including email, social media, website visits, and customer support interactions.
- Sequence: The order in which these touchpoints occur. Understanding the sequence helps identify if users are skipping critical steps.
- Time Spent: The duration a user spends on a page or between steps. High time on page might indicate engagement or confusion.
- Device and Context: Whether the user is on mobile or desktop, and what time of day they are interacting.
When aggregated, this data paints a picture of the actual user journey versus the intended journey. Discrepancies between the two are where the leaks often hide.
Step-by-Step Analysis Framework 📋
Implementing a fix for funnel leakage requires a structured approach. Random changes rarely yield sustainable results. Instead, adopt a framework that prioritizes data collection, analysis, hypothesis, and testing.
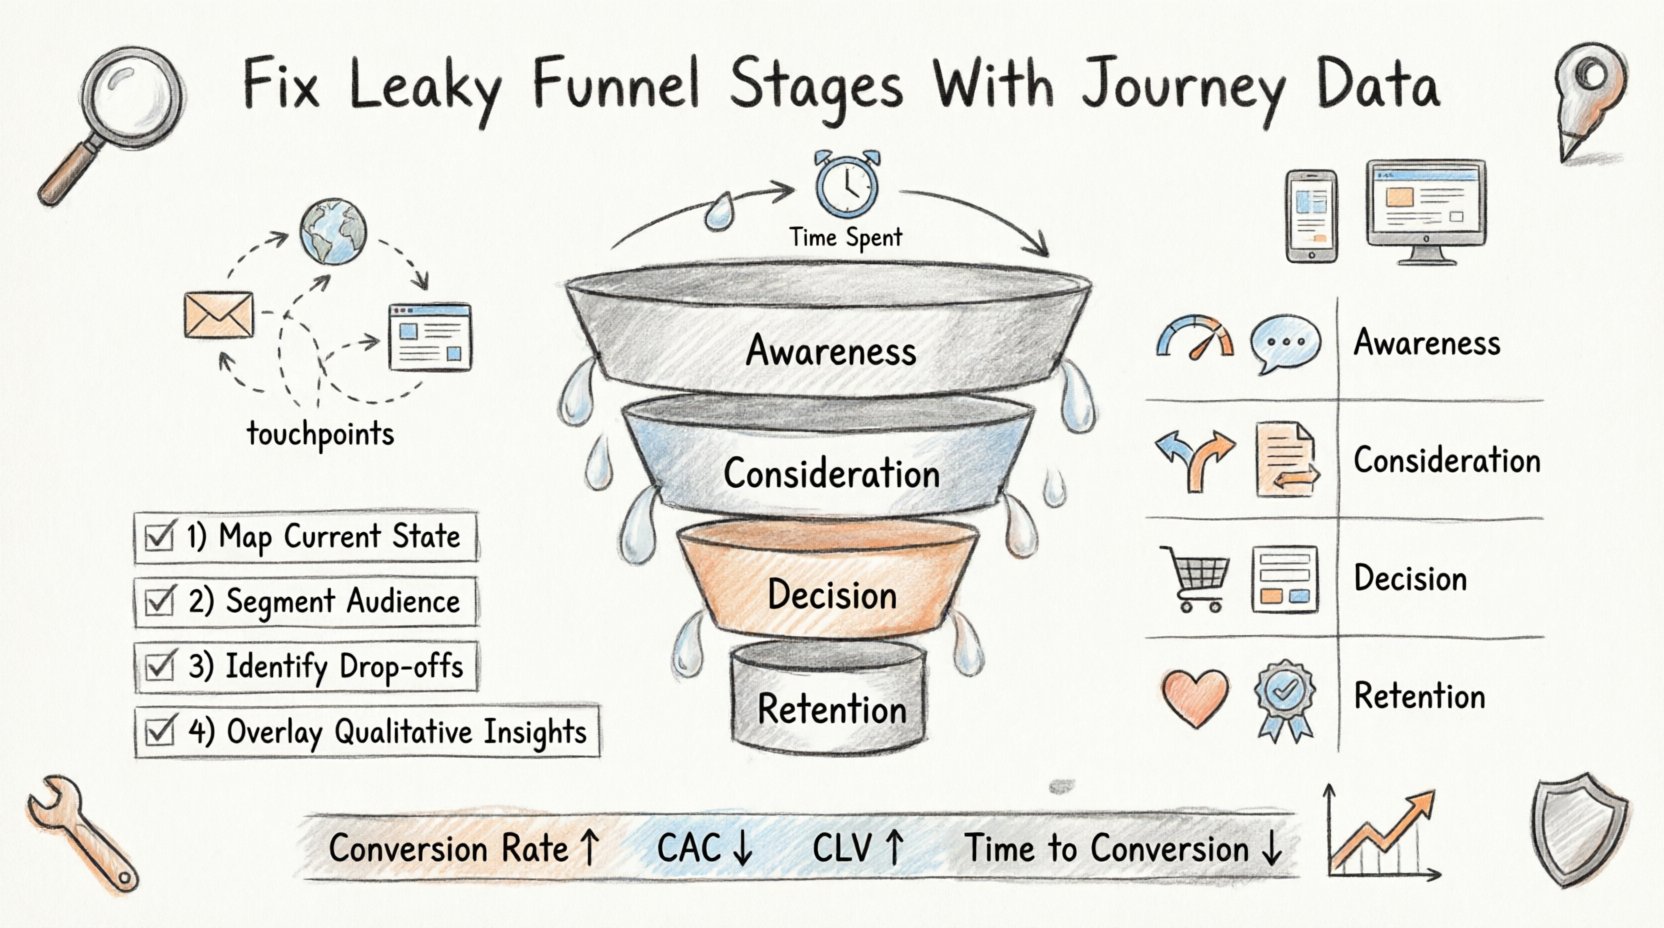
1. Map the Current State
Before fixing anything, you must know what exists. Document the current funnel stages and the expected flow. Create a visual map that outlines every touchpoint a user encounters. This serves as the baseline against which actual journey data will be compared.
2. Segment the Audience
Not all users behave the same way. A leak in the funnel might be specific to a certain demographic or source. Segment your data by:
- Acquisition Channel: Organic search, paid ads, social media, direct traffic.
- User Type: New visitors vs. returning users.
- Behavioral Patterns: High-intent users vs. browsers.
Segmentation reveals if the leak is universal or isolated to a specific group. This prevents over-generalizing problems and allows for tailored solutions.
3. Identify the Drop-off Points
Using journey data, pinpoint exactly where the majority of users leave the funnel. Look for:
- Sudden Spikes in Exit Rates: A page where 50% of users leave immediately.
- Long Delays: Users pausing for an extended period before moving to the next step.
- Repetition: Users revisiting previous pages, indicating they did not find what they needed.
4. Overlay Qualitative Insights
Numbers tell you where the leak is; qualitative data tells you why. Supplement quantitative funnel data with:
- Session Recordings: Watch users navigate the site to see where they hesitate or click randomly.
- Surveys and Feedback: Ask exiting users why they left. Exit-intent surveys can capture this data without interrupting the flow.
- Customer Support Logs: Review tickets to see if users are reporting confusion or technical errors.
Common Leak Points and Remediation Strategies 🛠️
Different stages of the funnel present unique challenges. By mapping journey data to specific stages, you can apply targeted fixes. The table below outlines common leak points and strategic approaches to address them.
| Funnel Stage | Common Leak Indicator | Potential Cause | Remediation Strategy |
|---|---|---|---|
| Awareness | High Bounce Rate | Mismatched Ad Copy or Page Load Speed | Align messaging with ad intent; optimize site speed. |
| Consideration | Low Engagement on Content | Content is too generic or hard to find | Improve navigation; personalize content based on interests. |
| Decision | Cart Abandonment | Unexpected Costs or Complex Forms | Add progress indicators; show costs early; simplify forms. |
| Retention | Low Repeat Purchase Rate | Poor Post-Purchase Experience | Implement onboarding emails; offer loyalty incentives. |
Let us examine these stages in greater detail to understand how journey data informs the strategy.
Awareness Stage: The Entry Point
If users leave immediately upon landing, the issue is likely one of expectation mismatch. Journey data shows that users arriving from specific channels may behave differently. For example, users from social media might expect a visual-heavy experience, while users from search might want detailed information.
Actionable Fix: Analyze the bounce rate by traffic source. If paid search traffic bounces high, check if the landing page content matches the search query intent. If social traffic bounces, ensure the page loads quickly and mobile experience is seamless.
Consideration Stage: The Evaluation
At this stage, users are researching. They compare options and seek validation. A leak here often stems from a lack of trust or information clarity. If journey data shows users clicking back and forth between pages, they might be struggling to find comparison data or testimonials.
Actionable Fix: Enhance the information architecture. Ensure case studies, FAQs, and product comparisons are easily accessible. Use journey data to see which content pieces are most frequently viewed before conversion and promote them more prominently.
Decision Stage: The Transaction
This is the most critical point for revenue. Leakage here is often due to friction in the checkout or sign-up process. Journey data might reveal that users drop off at the shipping cost reveal or when asked to create an account.
Actionable Fix: Implement guest checkout options. Display costs upfront. Simplify form fields to only what is necessary. Use heatmaps to see if users are ignoring key buttons or getting stuck on form validation errors.
Retention Stage: The Loyalty
Acquiring a customer is costly; losing one is a direct loss of ROI. Leakage in retention often happens after the first purchase. If journey data shows low engagement with post-purchase emails or low repeat visit frequency, the onboarding experience may be failing.
Actionable Fix: Map the post-purchase journey. Send timely onboarding sequences. Provide clear value on how to use the product. Offer support channels that are easy to find during the first few days of usage.
Implementing Changes Without Disruption 🔄
Once the root causes are identified, the next step is implementation. However, making changes to a live funnel carries risk. It is vital to validate improvements before rolling them out widely.
- Run A/B Tests: Test the proposed fix against the current version. Measure which version performs better in terms of conversion rate and engagement.
- Monitor Key Metrics: Keep an eye on the metrics that indicate health, such as session duration and return visits, not just conversion. A change might boost conversions but hurt user satisfaction.
- Gradual Rollout: If possible, release changes to a percentage of users first. This limits the impact if the change introduces new issues.
- Feedback Loops: After implementation, gather user feedback to see if the change resolved the friction points identified in the journey data.
This iterative process ensures that fixes are data-driven and verified. It prevents the common pitfall of making changes based on assumptions rather than evidence.
Long-Term Maintenance of Funnel Health 🛡️
Fixing a leaky funnel is not a one-time event. User behavior, market conditions, and technology evolve. A funnel that is healthy today may develop new leaks tomorrow. Continuous monitoring is required to maintain performance.
Regular Audits
Schedule quarterly reviews of funnel performance. Look for new patterns in the journey data. Are there new drop-off points? Have existing leak points returned? Regular audits ensure that the funnel remains optimized as the business scales.
Cultural Integration
Journey data should not be the sole responsibility of the analytics team. It is a cross-functional asset. Sales, marketing, product, and support teams should all have visibility into funnel health. When everyone understands where the leaks are, the entire organization can work towards fixing them.
- Marketing: Ensures traffic quality matches funnel expectations.
- Product: Improves the user experience based on behavioral data.
- Support: Identifies common pain points reported by users.
Adapting to Market Shifts
External factors, such as economic changes or new competitor offerings, can alter user behavior. If a competitor launches a feature that changes expectations, your funnel may need to adapt. Journey data helps detect these shifts early by highlighting changes in user paths and engagement patterns.
Measuring Impact and ROI 📈
Finally, you must measure the success of the fixes. Without clear metrics, it is impossible to justify the resources spent on optimization. Define clear success criteria before starting any initiative.
- Conversion Rate Increase: The primary metric for most stages.
- Customer Acquisition Cost (CAC): Effective fixes should lower the cost to acquire a customer by improving efficiency.
- Customer Lifetime Value (CLV): Improvements in retention should increase the total value of a customer over time.
- Time to Conversion: A smoother journey often reduces the time it takes for a user to complete a purchase.
Track these metrics over time to establish a baseline and measure growth. Use journey data to correlate specific changes with improvements in these metrics. This creates a clear line of sight between the optimization work and business outcomes.
Final Considerations for Sustainable Growth 🏁
Optimizing a funnel is an exercise in empathy. It requires understanding the user’s perspective and removing obstacles that prevent them from achieving their goals. By leveraging journey data, teams can move beyond guesswork and make informed decisions that enhance the customer experience.
The process involves diagnosis, segmentation, analysis, and iterative testing. It requires collaboration across departments and a commitment to continuous improvement. When executed correctly, fixing leaky funnel stages leads to higher efficiency, better user satisfaction, and increased revenue.
Remember that the goal is not to force users through a funnel, but to guide them through a journey that feels intuitive and valuable. Every drop-off point is an opportunity to learn and improve. By treating journey data as a strategic asset, organizations can build a resilient funnel that adapts to changing needs and drives long-term success.
Start by auditing your current data. Identify the biggest leaks. Formulate a hypothesis. Test it. Measure the result. This cycle of improvement is the foundation of sustainable growth in any digital business.