Designing complex systems requires more than just writing code; it requires a clear blueprint of how the system behaves under various conditions. When dealing with intricate workflows where the state of an object dictates its next action, traditional sequence diagrams often fall short. This is where the UML Interaction Overview Diagram (IOD) becomes an indispensable tool. This guide provides a comprehensive walkthrough on utilizing IODs to map state transitions effectively, ensuring clarity and precision in your system architecture.
Many architects struggle with visualizing how different interaction scenarios connect across varying system states. The risk of losing track of logic flow increases as the number of states and transitions grows. By leveraging the structured nature of Interaction Overview Diagrams, you can create a high-level view that links specific interaction scenarios through control flow nodes. This approach reduces cognitive load and highlights potential bottlenecks before implementation begins.
🧩 Understanding the Interaction Overview Diagram
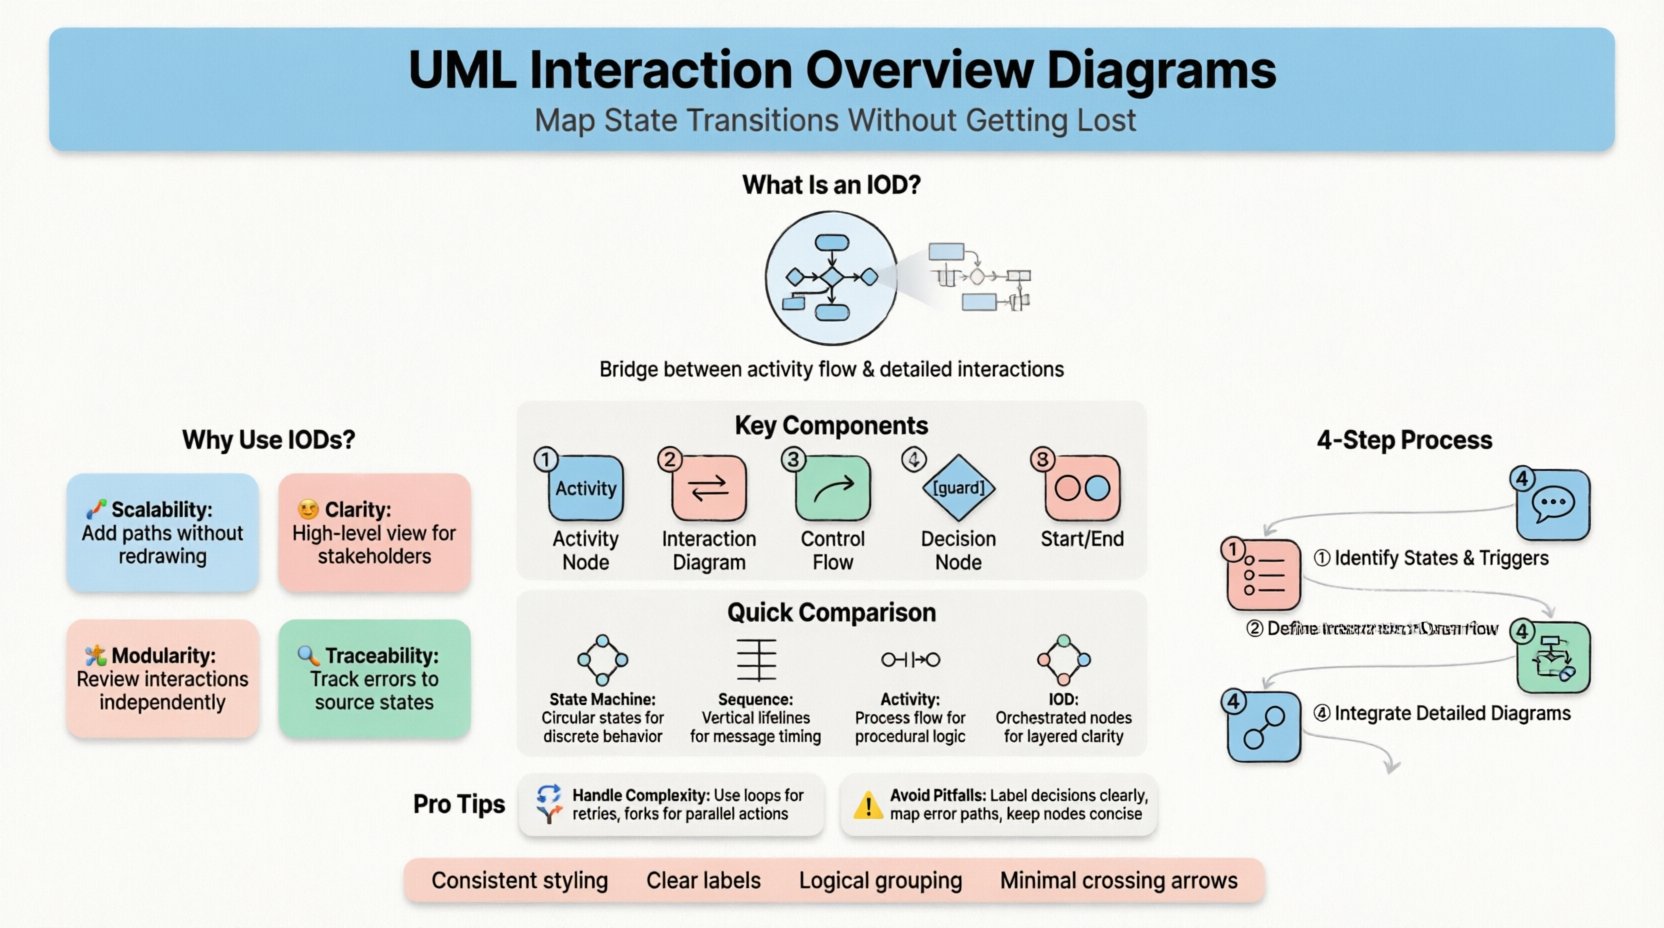
An Interaction Overview Diagram is a specialized type of activity diagram that incorporates interaction diagrams. It serves as a bridge between high-level activity flow and detailed object communication. Unlike a standard Sequence Diagram, which focuses on a single linear scenario, an IOD allows you to orchestrate multiple scenarios. This is particularly useful when a system enters different states based on user input, external events, or internal logic checks.
Key characteristics of an IOD include:
- Activity Nodes: Represent the main flow of control, similar to a standard activity diagram.
- Interaction Diagrams: Embedded sequence or communication diagrams that detail specific interactions within a node.
- Control Flow: Arrows connecting activity nodes to define the order of execution.
- Decision and Merge Nodes: Used to branch logic based on conditions (guards) and recombine paths.
- Initial and Final Nodes: Define the start and end points of the overall process.
When mapping state transitions, the IOD excels by allowing you to encapsulate the detailed message exchange required for a specific state change within a single activity node. This keeps the overview clean while retaining necessary detail upon expansion.
🔄 Why Use IODs for State Transitions?
State machines are excellent for defining the rules of a single object, but they do not always capture the external interactions required to trigger those transitions. Conversely, sequence diagrams capture interactions well but struggle to show the broader context of how one scenario leads to another across different states. The Interaction Overview Diagram addresses this gap.
Consider a scenario where a user initiates a transaction. The system must check for authentication, validate funds, process the payment, and log the event. Each of these steps might occur in different states (e.g., Idle, Processing, Completed, Failed). An IOD allows you to visualize the flow from one state to another without getting bogged down in the message sequence of every single step.
Benefits of this approach include:
- Scalability: You can add new state transition paths without redrawing the entire interaction flow.
- Clarity: High-level stakeholders can understand the flow without needing to read detailed sequence diagrams immediately.
- Modularity: Each interaction node can be developed or reviewed independently.
- Traceability: It is easier to trace a specific error path back to the state that triggered it.
📋 Comparing Modeling Techniques
To understand where the IOD fits, it helps to compare it with other common UML diagrams used in system design. The table below outlines the specific use cases for each diagram type regarding state and interaction modeling.
| Diagram Type | Primary Focus | Best Used For | Limitation with State Transitions |
|---|---|---|---|
| State Machine Diagram | Object Lifecycle | Defining valid states and triggers for a specific object. | Does not show the interaction messages required to trigger transitions. |
| Sequence Diagram | Message Flow | Detailing the step-by-step message exchange for one scenario. | Becomes difficult to manage when multiple scenarios depend on different states. |
| Activity Diagram | Process Flow | High-level business logic and workflow. | Lacks the granularity of object interactions and message details. |
| Interaction Overview Diagram | Orchestrated Interactions | Linking multiple sequence scenarios across state changes. | Can become complex if too many details are embedded in nodes. |
🚀 Step-by-Step: Mapping State Transitions
Creating an effective Interaction Overview Diagram requires a methodical approach. You must define the states, the triggers, and the interactions clearly before drawing the control flow. Follow these steps to construct your diagram without confusion.
1. Identify the States and Triggers
Begin by listing the distinct states your system object can occupy. For each state, identify the events or conditions that cause a transition to a new state. Do not attempt to draw the diagram until this logic is documented in text or a state machine notation.
- List all possible states (e.g., Unauthenticated, Authenticated, Processing, Error).
- Define the triggers for each transition (e.g., Login Attempt, Payment Success, Timeout).
- Identify any guards (conditions) that must be true for a transition to occur.
2. Define the Interaction Scenarios
For each state transition identified in the previous step, you must define the interaction required to achieve it. This is where you plan the embedded sequence diagrams. Ask yourself: What messages are sent? Which objects participate? What is the return value?
For example, if the transition is from Authenticated to Processing, the interaction might involve:
- A request message sent from the Controller to the Service Layer.
- A validation check performed by the Validator component.
- A confirmation message returned upon successful validation.
Create a separate interaction diagram for each of these scenarios. Keep them focused on the specific logic required for that transition.
3. Construct the Overview Flow
Now, open your modeling environment to create the Interaction Overview Diagram. Start with the initial node. This represents the entry point into the workflow, often corresponding to the system receiving an external request.
Draw an activity node for the first interaction scenario. Label this node clearly, such as “Validate Login Credentials”. Connect this to a decision node. The decision node represents the state transition logic. For example, if validation succeeds, the flow moves to the Processing state. If it fails, the flow moves to the Error state.
Continue adding nodes for subsequent states. Each node represents a distinct interaction phase. Use control flow arrows to indicate the path of execution. Ensure that every path eventually leads to a final node or loops back to a valid state.
4. Integrate Interaction Diagrams
Once the high-level flow is established, embed the detailed interaction diagrams into the activity nodes. This is done by linking the activity node to the corresponding sequence or communication diagram. This linkage creates a hyperlink within your modeling environment, allowing you to drill down from the overview to the details.
- Ensure the names of the nodes match the names of the interaction diagrams.
- Keep the embedded diagrams concise; if they become too large, consider splitting them into sub-diagrams.
- Use comments or notes to explain complex logic within the nodes if necessary.
🧠 Handling Complexity and Loops
Complex systems rarely follow a straight line. They involve loops, retries, and conditional branches. Managing these elements in an IOD can be challenging. Here is how to handle them effectively.
Loops and Iterations
When a state transition requires repeated actions (such as retrying a failed network request), use a loop structure within the activity node. You can define a loop condition that checks if the maximum retry limit has been reached. If not, the flow returns to the previous interaction node.
Best practices for loops:
- Set a clear exit condition to prevent infinite loops.
- Ensure the state is updated correctly within the loop (e.g., incrementing a retry counter).
- Document the loop limit clearly in the diagram notes.
Parallel Flows
Sometimes, multiple actions must happen simultaneously to complete a state transition. For example, processing an order might require updating the inventory and charging the credit card at the same time. Use fork nodes to split the control flow into parallel paths.
- Place a fork node before the parallel interactions.
- Place a join node after the parallel interactions to synchronize the flow.
- Ensure that the join node waits for all incoming paths before proceeding.
⚠️ Common Pitfalls and How to Avoid Them
Even with a solid plan, mistakes can occur during the modeling process. Being aware of common pitfalls helps you maintain the integrity of your diagram.
- Too Much Detail in Nodes: Do not embed full sequence diagrams inside the activity nodes if they are too complex. This defeats the purpose of having an overview. Use sub-activities instead.
- Unclear Decision Logic: Avoid ambiguity in decision nodes. Every outgoing arrow must have a clear label or guard condition (e.g., “Success” vs “Failure”).
- Disconnected States: Ensure every state is reachable from the start node and can reach a valid end node. Dead ends indicate logic gaps.
- Inconsistent Naming: Use consistent terminology across the IOD and the embedded interaction diagrams. Confusion here leads to implementation errors.
- Ignoring Error Paths: Do not just model the happy path. Explicitly map out error handling and rollback states.
🔍 Review and Validation
Once the diagram is complete, it requires validation. A diagram that cannot be understood by the development team is a liability. Perform the following checks:
- Logic Check: Walk through the diagram as if you were executing the code. Does every path make sense?
- Completeness Check: Are all possible states and transitions accounted for?
- Consistency Check: Do the embedded interaction diagrams match the high-level flow?
- Readability Check: Is the layout clean? Do arrows cross unnecessarily? Use routing features to minimize line intersections.
🛠️ Maintenance and Evolution
System requirements change. The Interaction Overview Diagram must evolve with them. When a new feature is added or a bug is fixed, update the diagram immediately.
- Version Control: Treat the diagram file like code. Commit changes to version control systems to track history.
- Change Impact Analysis: Before modifying a node, check if it affects other interaction scenarios or state transitions.
- Documentation: Update accompanying documentation to reflect changes in the diagram.
Maintaining the diagram ensures that the source of truth remains accurate. This reduces the time developers spend deciphering outdated logic and prevents integration issues during deployment.
📝 Best Practices for Clarity
To ensure the diagram remains a useful asset throughout the project lifecycle, adhere to these best practices:
- Consistent Styling: Use standard shapes and colors for nodes, decisions, and flows. Avoid custom styling unless it conveys specific meaning.
- Logical Grouping: Group related states together visually to help the reader understand the context of the flow.
- Minimal Arrows: Reduce the number of crossing lines. Use orthogonal routing to keep the diagram tidy.
- Clear Labels: Every arrow must be labeled with the event or condition that triggers the transition.
- Scope Management: Keep the scope of the IOD focused. If the system is too large, break it down into multiple IODs for different subsystems.
🌟 Final Considerations
Mapping state transitions using UML Interaction Overview Diagrams is a powerful strategy for managing complexity. It provides a structured way to visualize how different interaction scenarios connect and how states influence the flow of control. By following a disciplined approach to modeling, you can create diagrams that serve as reliable blueprints for development.
The key lies in balancing detail with abstraction. Embed enough information to be precise, but keep the overview high-level enough to be readable. With careful planning and regular maintenance, the IOD becomes a cornerstone of your system design documentation, guiding the team through the intricacies of state-based logic without getting lost in the details.