Mapping the customer journey is often treated as a creative exercise. Teams draw lines, place icons, and sketch out emotional arcs. While visualization is valuable, it remains abstract without hard numbers. To truly understand performance, you must quantify the value of each journey stage. This process transforms vague assumptions into actionable intelligence. It shifts the conversation from “what are we doing?” to “what is the return on what we are doing?”.
Every interaction a user has with your brand carries a cost and a potential reward. Some interactions are friction points that drain resources. Others are high-value engagements that drive retention. Without quantification, you are navigating blind. You might optimize a stage that does not move the needle, while ignoring a critical bottleneck that stalls conversion. This guide details how to measure, analyze, and assign value to specific touchpoints within the customer lifecycle.
Why Qualitative Data Isn’t Enough 📉
Qualitative data tells you why customers feel a certain way. Surveys, interviews, and open-ended feedback provide depth. They reveal frustration, delight, or confusion. However, qualitative data rarely tells you how much impact a specific stage has on the bottom line. You might hear repeatedly that checkout is confusing. But does that confusion actually stop 50% of users, or is it a minor annoyance for 1%? Without numbers, you cannot prioritize.
Reliance on anecdotes leads to the “HiPPO” effect (Highest Paid Person’s Opinion). Decisions are made based on the loudest voice in the room rather than the most significant data point. Quantification grounds your strategy in reality. It allows you to compare the cost of acquiring a lead at the top of the funnel against the revenue generated at the bottom. It reveals the true efficiency of your operations.
- Subjectivity vs. Objectivity: Feelings change. Metrics remain consistent over time.
- Resource Allocation: Money is finite. Data shows where it yields the highest return.
- Predictive Power: Historical data helps forecast future performance at each stage.
Defining Value Across the Funnel 🎯
Value is not a single metric. It varies depending on the stage of the journey. A lead at the awareness stage has a different value than a customer in the retention stage. To quantify value accurately, you must define what matters at each step.
1. Awareness Stage Value
At this point, the goal is reach and visibility. Value is often measured in impressions, traffic volume, and cost per impression. However, raw traffic is vanity. The true value lies in the quality of that traffic. Are these visitors likely to convert later? Assigning value here involves estimating the potential lifetime value (LTV) of the audience segment attracted.
2. Consideration Stage Value
Here, the user is evaluating options. Value is tied to engagement depth. Time on page, scroll depth, and content downloads indicate interest. Quantifying this stage means calculating the cost of acquisition per qualified lead versus the cost per mere visitor. If you spend $10 to get a visitor and $50 to get a qualified lead, the value of the consideration stage is the difference between wasted spend and potential revenue.
3. Decision Stage Value
This is where revenue is generated. Value is direct. It is the transaction amount, minus the cost of goods sold and the cost of acquisition. However, it also includes the probability of success. If a stage has a 10% conversion rate, its value is the average order value multiplied by that rate.
4. Retention Stage Value
Many organizations ignore this, yet it is often where the highest value resides. A repeat purchase is cheaper than a new acquisition. Value here is measured by repeat purchase rate, churn rate, and net promoter score. Quantifying this involves calculating the cost savings of retaining an existing customer compared to acquiring a new one.
Key Metrics for Each Stage 📊
To move forward, you need specific indicators. The following table outlines the essential metrics for quantification. These are not just numbers to track; they are levers you can pull to improve performance.
| Journey Stage | Primary Metric | Secondary Metric | Value Indicator |
|---|---|---|---|
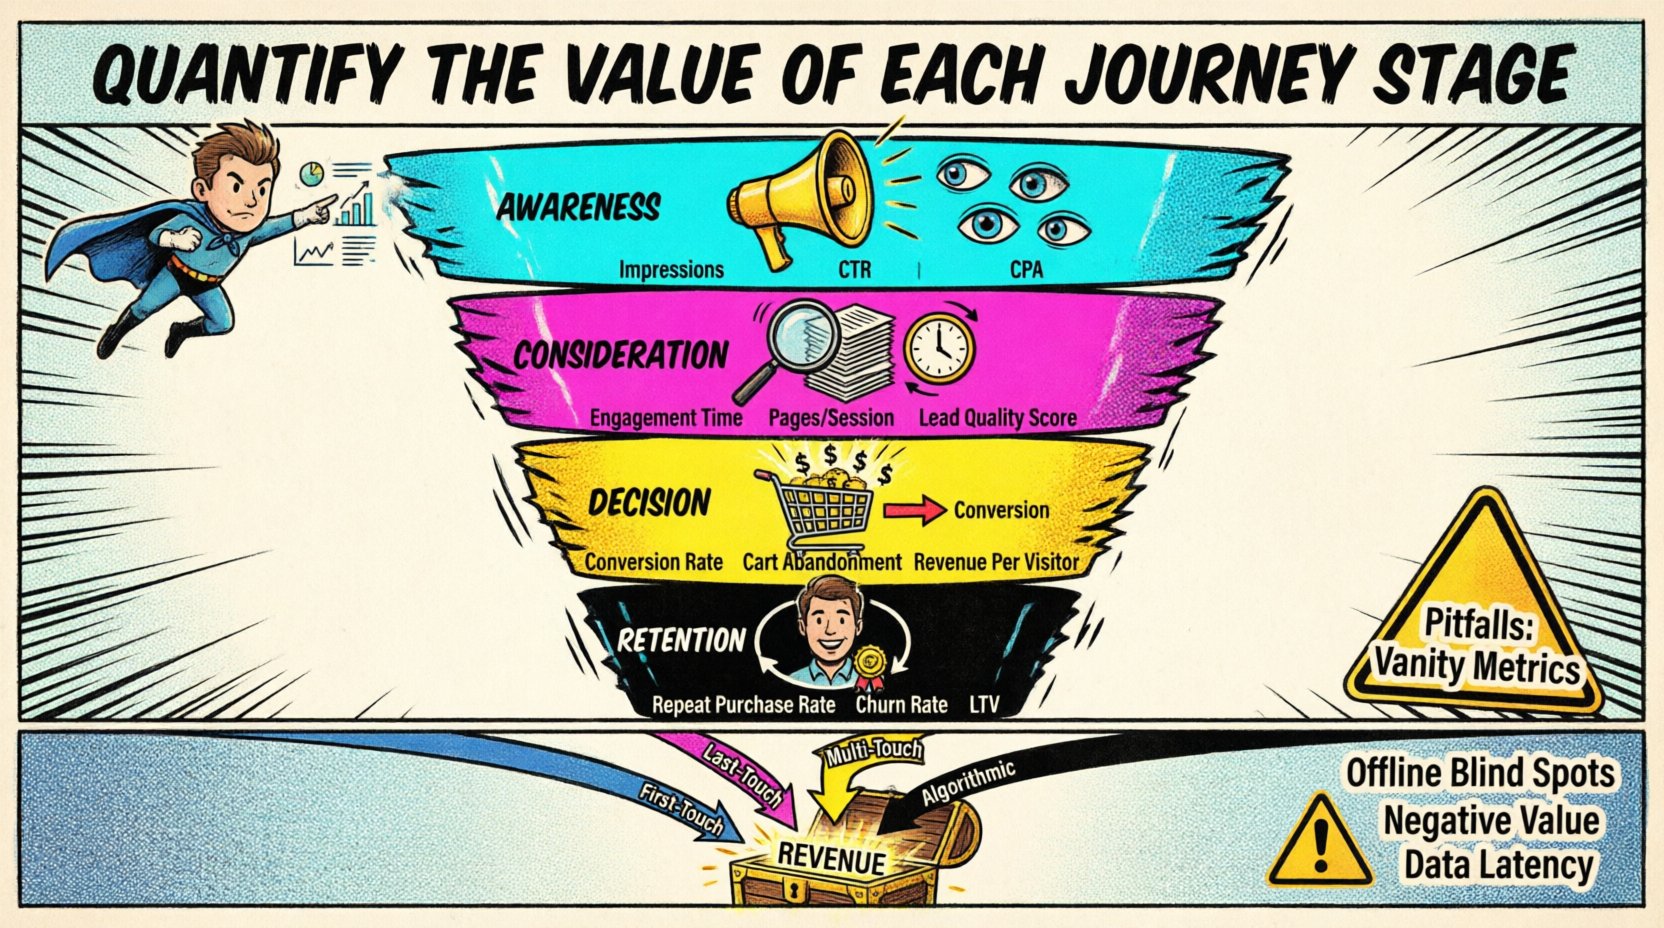
| Awareness | Impressions | Click-Through Rate (CTR) | Cost Per Acquisition (CPA) |
| Consideration | Engagement Time | Pages per Session | Lead Quality Score |
| Decision | Conversion Rate | Cart Abandonment | Revenue Per Visitor (RPV) |
| Retention | Repeat Purchase Rate | Churn Rate | Customer Lifetime Value (LTV) |
Breaking Down the Table
- Cost Per Acquisition: In the awareness stage, you are buying attention. If you spend $100 and get 1,000 impressions, but zero clicks, the acquisition cost is high. If you get 100 clicks, the cost drops. This metric helps you evaluate channel efficiency.
- Lead Quality Score: Not all leads are equal. A download of a whitepaper is worth less than a demo request. Assigning a numerical score to leads based on their behavior allows you to weigh the value of the consideration stage more accurately.
- Revenue Per Visitor: This is the holy grail of the decision stage. It combines conversion rate and average order value. Increasing this metric means you get more money from the same amount of traffic, effectively quantifying the value of your sales process.
- Customer Lifetime Value: In retention, time is money. A customer who stays for three years is worth significantly more than one who stays for three months. Calculating LTV helps you decide how much to spend on retention efforts.
Methodologies for Attribution 📊
Once you have metrics, you need to assign credit. This is the art and science of attribution. When a customer buys a product, which touchpoint gets the credit? Was it the first ad they saw? The last email they opened? The sales call they attended? The method you choose affects how you quantify value.
First-Touch Attribution
This model gives 100% credit to the first interaction. It is useful for understanding which channels drive new awareness. If you quantify value this way, you might prioritize top-of-funnel marketing over retention efforts. It highlights the cost of entry.
Last-Touch Attribution
This model gives 100% credit to the final interaction before conversion. It is common but often misleading. It ignores the nurturing process that happened before. If you use this, you might undervalue the consideration stage and overvalue the decision stage.
Multi-Touch Attribution
This distributes credit across several touchpoints. Linear models give equal credit. Time-decay models give more credit to recent interactions. Position-based models give more credit to the first and last interactions. For quantifying value accurately, multi-touch is generally preferred because it acknowledges the complexity of the modern journey.
Algorithmic Attribution
Using machine learning to determine the most likely path to conversion. This is the most accurate method but requires significant data volume. It calculates the marginal impact of each touchpoint. If removing a specific email campaign drops conversions by 5%, that campaign has a quantified value of 5% of total revenue.
Connecting Touchpoints to Revenue 💰
The ultimate goal of quantification is linking specific actions to revenue. This requires a robust data infrastructure. You must ensure that data flows seamlessly from marketing to sales to finance. Silos kill value quantification. If your marketing data does not talk to your CRM, you cannot see the full picture.
1. Mapping Costs to Stages
Every stage incurs a cost. Marketing spend, sales labor, customer support time, and platform fees. To find the net value, you must subtract these costs from the revenue generated at that stage. A stage might generate high revenue but consume disproportionate resources, resulting in a low net margin.
2. Calculating Time Value
Speed matters. A customer who moves from awareness to purchase in one week is more valuable than one who takes six months. The time value of money applies here. Revenue received sooner is worth more than revenue received later. Quantify the average cycle time and adjust the value of the stage accordingly.
3. Identifying Leakage
Where do customers drop off? If 1,000 people enter the funnel and only 100 buy, 900 are lost. Quantifying the value of the leakage means calculating the lost revenue potential. If the average order is $100, a 10% drop-off rate represents a $10,000 loss per 1,000 visitors. This highlights the financial cost of friction.
Common Pitfalls in Quantification ⚠️
Even with good data, mistakes happen. Avoiding these common errors is crucial for maintaining accuracy.
- Focusing on Vanity Metrics: Page views and likes look good on a dashboard but rarely correlate with revenue. Focus on metrics that drive business outcomes.
- Ignoring Offline Interactions: Many journeys cross digital and physical boundaries. A phone call, a store visit, or a sales meeting cannot be tracked via cookies. You must find ways to capture these touchpoints to avoid undervaluing them.
- Overlooking Negative Value: Some stages might have negative value. A confusing FAQ page might frustrate users so much they leave forever. If you only measure positive conversion, you miss the cost of bad experiences.
- Data Latency: Waiting for end-of-month reports can be too slow. Real-time or near-real-time data allows for quicker adjustments. If you wait too long to quantify value, the opportunity to fix the issue may be gone.
Implementing a Measurement Framework 🛠️
Start small. You do not need to measure everything at once. Build a framework that scales with your organization.
- Define Your Stages: Clearly map out your journey. Ensure all teams agree on what constitutes the “Awareness” stage versus the “Consideration” stage.
- Select Your Tools: Use analytics platforms to track behavior. Ensure tracking pixels and event tags are firing correctly. Data integrity is non-negotiable.
- Establish Baselines: Measure current performance before making changes. You cannot know if you improved if you do not know where you started.
- Assign Monetary Values: This is the hardest step. You may need to estimate based on historical averages or industry benchmarks. Be transparent about these estimates.
- Review Regularly: Customer behavior changes. A metric that was valuable last year might be irrelevant today. Schedule quarterly reviews of your measurement framework.
Iterating Based on Data 🔁
Quantification is not a one-time task. It is a cycle. Once you have the numbers, you test. You change a button color, rewrite a headline, or adjust a pricing model. Then you measure again. This creates a feedback loop.
A/B Testing for Value
Run controlled experiments to isolate variables. If you change the checkout process, does the value of the decision stage increase? Compare the control group against the test group. If the test group generates higher revenue per visitor, the change has positive value.
Segmenting for Precision
Average values can hide important details. A journey stage might be highly valuable for enterprise clients but worthless for small businesses. Segment your data by customer type, geography, or acquisition channel. This granular view allows you to quantify value for specific personas.
Continuous Optimization
Use the data to inform resource allocation. If the consideration stage has a low ROI, invest less there. If the retention stage has high LTV, invest more in customer support. Let the numbers guide your strategy, not intuition.
The Human Element in Data 🧠
While numbers are vital, they do not tell the whole story. Quantification provides the skeleton; qualitative insights provide the flesh. When a metric drops, it tells you that something is wrong. It does not always tell you why. Combine your quantified values with user feedback to understand the context.
For example, if the value of the decision stage drops, check your support tickets. Are customers complaining about shipping costs? If so, the drop is quantifiable, but the root cause is emotional or logistical. This combination ensures your strategy remains empathetic while remaining profitable.
Ultimately, the goal is to build a business that is both efficient and effective. By quantifying the value of each journey stage, you ensure that every dollar spent is justified by the return it generates. This disciplined approach separates thriving organizations from those that merely survive.