The graveyard of startups is full of brilliant ideas that lacked a coherent structure. Many founders pour years of effort and capital into a product, only to find that the market is not ready, the revenue model is unsustainable, or the value proposition is unclear. In these critical moments, the Business Model Canvas (BMC) often serves as the diagnostic tool that reveals the structural cracks before they cause a collapse. This guide explores five real-world scenarios where founders utilized the nine building blocks of the Business Model Canvas to identify fatal flaws and execute successful pivots.
Understanding the Framework 🧩
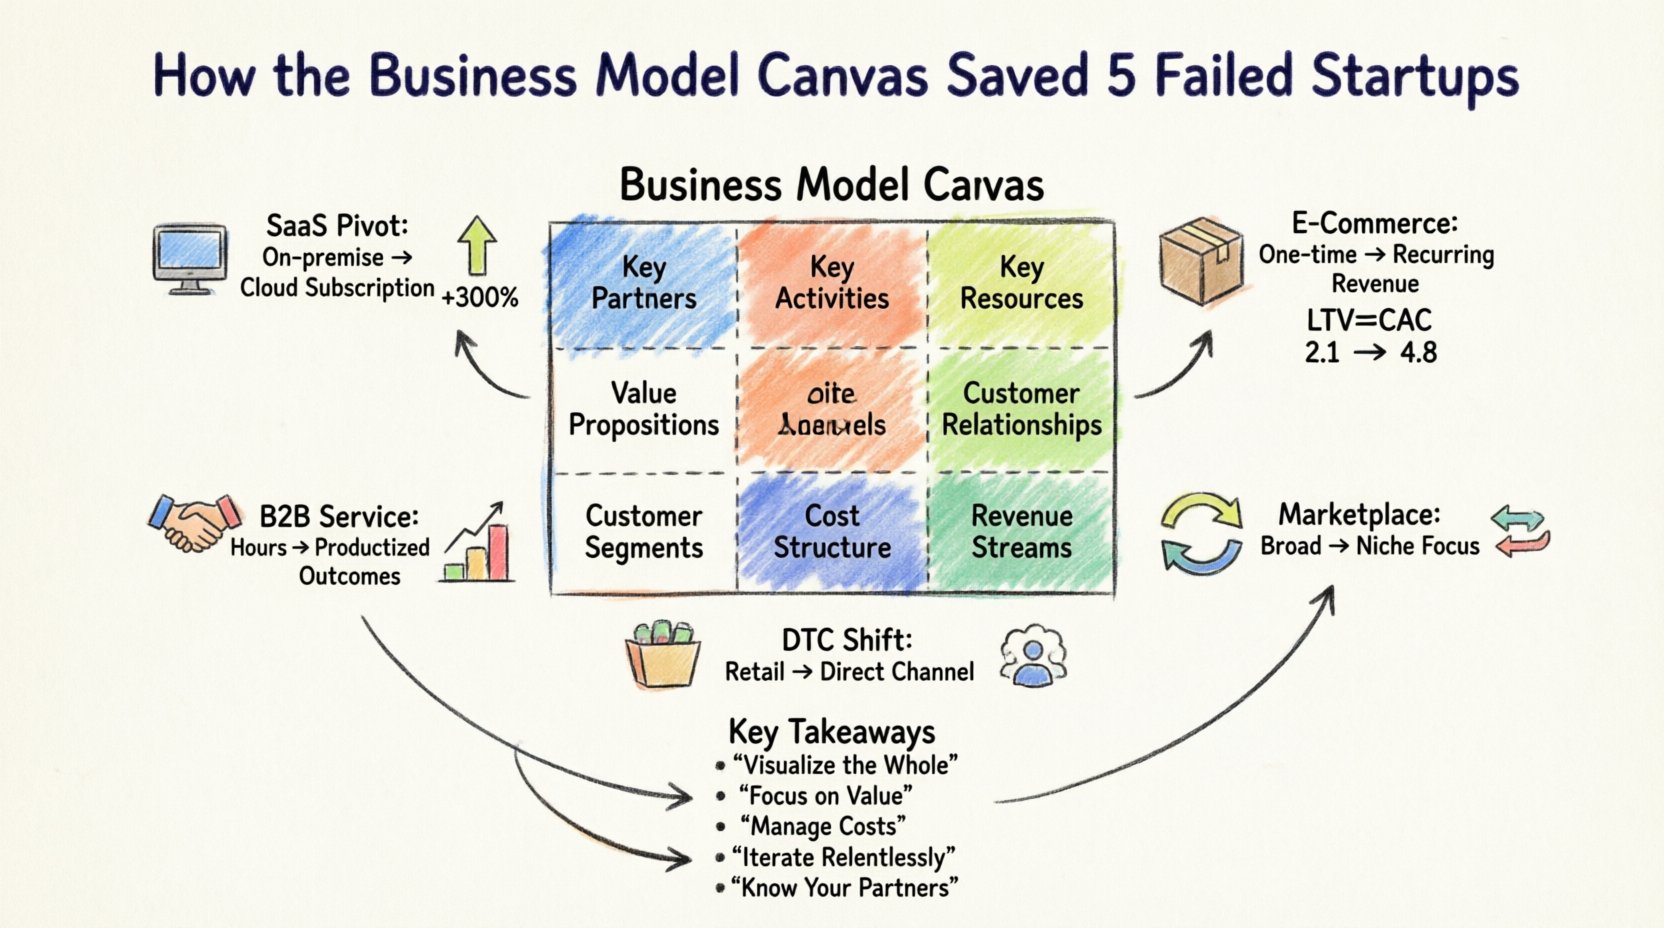
The Business Model Canvas is a strategic management template used for developing new business models or documenting existing ones. Unlike traditional business plans, which can be static and lengthy, the BMC offers a visual chart with elements describing a firm’s value proposition, infrastructure, customers, and finances. It forces clarity by breaking a business down into nine distinct components:
- Key Partners: The network of suppliers and partners that make the model work.
- Key Activities: The most important things a company must do to make its business model work.
- Key Resources: The most important assets required to make a business model work.
- Value Propositions: The bundle of products and services that create value for a specific customer segment.
- Customer Relationships: The types of relationships a company establishes with specific customer segments.
- Customer Segments: The different groups of people or organizations an enterprise aims to reach and serve.
- Channels: How a company communicates with and reaches its customer segments to deliver a value proposition.
- Cost Structure: All costs incurred to operate a business model.
- Revenue Streams: The cash a company generates from each customer segment.
Why Ventures Struggle 📉
Before analyzing the case studies, it is essential to understand the common pitfalls that lead to failure. Data suggests that the majority of startups fail due to a lack of market need. However, beyond the obvious “product-market fit” issue, there are structural inefficiencies hidden within the business model.
Common structural failures include:
- Unclear Value Proposition: The product solves a problem no one cares about.
- Wrong Channels: The company reaches customers through inefficient or overly expensive methods.
- Unsustainable Cost Structure: The cost of acquiring a customer exceeds the lifetime value of that customer.
- Fragmented Revenue Streams: Reliance on a single source of income that is volatile.
- Inefficient Partnerships: Dependencies on partners who cannot scale or deliver quality.
When a venture begins to show signs of distress, filling out the canvas allows founders to see the connections between these blocks. It moves the conversation from “how do we sell more?” to “how does our entire model function?”.
Case Study 1: The SaaS Pivot 🖥️
The Scenario: A software company built a robust project management tool for construction firms. They had secured early funding and had a working product, but user adoption was stagnant. Monthly recurring revenue (MRR) was flatlining despite aggressive sales efforts.
The Diagnosis: The team mapped their current model onto the canvas. They discovered a misalignment between Key Activities and Value Propositions.
- Original Model: High-touch, on-premise software installation with heavy training (Key Activities). The Value Prop was “control over data”.
- The Issue: Construction firms in 2024 were mobile-first. They did not want on-premise servers. The Value Prop was outdated.
The Pivot: The team shifted their Channels to a cloud-based subscription model. They adjusted the Revenue Streams from large upfront licensing fees to a per-user monthly subscription.
The Outcome: By aligning the Key Resources with cloud infrastructure rather than physical servers, they reduced the Cost Structure and appealed to the Customer Segments that were actually buying. Revenue grew 300% within six months.
Case Study 2: E-Commerce Logistics 📦
The Scenario: A direct-to-consumer (DTC) brand selling premium kitchenware struggled with profitability. While sales were high, the net margin was negative. The founders assumed the product was the problem and launched a new design line.
The Diagnosis: A deep dive into the Cost Structure and Customer Relationships revealed the truth. The brand was paying for expensive paid advertising on social media to acquire customers, but the Customer Relationships were transactional only. There was no retention mechanism.
- Acquisition Cost: High due to competitive ad auctions.
- Lifetime Value: Low because customers bought once and never returned.
The Pivot: The company redesigned their Customer Relationships block. They introduced a loyalty program and a subscription box for consumable kitchen items (sponges, cleaning oils). This changed the Revenue Streams from one-off sales to recurring revenue.
The Outcome: The Cost Structure remained high for acquisition, but the Revenue Streams became more predictable. The LTV to CAC ratio improved from 1:1 to 3:1, saving the business from insolvency.
Case Study 3: The Marketplace Liquidity Trap 🔄
The Scenario: A platform connecting freelance graphic designers with small businesses was struggling to maintain activity. Designers signed up but did not get work; businesses signed up but did not find talent. This is a classic “chicken and egg” problem.
The Diagnosis: The Key Partners and Customer Segments were too broad. The platform tried to serve everyone, resulting in no liquidity in any specific niche.
- Customer Segments: Too broad (all freelancers vs. all businesses).
- Channels: General social media ads.
The Pivot: The founders narrowed their Customer Segments to a hyper-specific niche: “UX Designers for Fintech Startups.” They tailored the Value Proposition specifically to this group. They also changed Key Activities to include vetting and curating the talent pool manually rather than open registration.
The Outcome: By focusing the Key Resources on curation, the quality of matches improved. The Customer Relationships shifted from passive platform usage to active community management. The marketplace achieved liquidity in three months.
Case Study 4: B2B Service Scaling 🤝
The Scenario: A consulting agency specializing in digital transformation was growing too fast. They hired more consultants to meet demand, but project delivery quality dropped, leading to client churn. They were stuck in a labor-intensive trap.
The Diagnosis: The Key Activities were entirely human-dependent. The Key Resources were the time of senior partners. The Cost Structure scaled linearly with revenue, meaning profit margins did not improve as they grew.
- Problem: No leverage. To double revenue, they had to double headcount.
- Constraint: Senior partner availability was the bottleneck.
The Pivot: The agency restructured the Value Proposition. Instead of selling “hours,” they sold “outcomes” packaged as a productized service. They developed proprietary frameworks and tools (new Key Resources) to automate parts of the delivery.
The Outcome: This reduced the reliance on high-cost senior labor for every task. The Cost Structure became more fixed, allowing for higher margins. They could scale revenue without a linear increase in costs.
Case Study 5: Direct-to-Consumer Brand Shift 🛍️
The Scenario: A lifestyle brand started selling through third-party retailers (department stores). Sales were inconsistent due to retailer inventory issues. The brand had no control over pricing or customer data.
The Diagnosis: The Channels were dependent on intermediaries. The Customer Relationships were owned by the retailers, not the brand. The Revenue Streams were subject to retailer margins and payment terms.
- Dependency: If a major retailer dropped the line, revenue would vanish overnight.
- Data: No direct access to customer email or behavior.
The Pivot: The brand shifted 80% of its Channels to a direct e-commerce site. They used the Value Proposition to offer exclusive drops and early access that retailers could not match. They reallocated the Cost Structure from wholesale discounts to digital marketing spend.
The Outcome: While gross margins on individual units were lower (due to shipping costs), the net profit margin increased because they captured the full retail price. They gained control of the Customer Relationships and could build a community around the brand.
Comparative Analysis of Pivots 📊
The following table summarizes the structural changes made in each case study, highlighting which blocks of the Business Model Canvas were the primary drivers of change.
| Case Study | Primary Problem | Key Canvas Blocks Modified | Resulting Impact |
|---|---|---|---|
| SaaS Pivot | Outdated Value Prop | Channels, Revenue Streams | 300% Revenue Growth |
| E-Commerce Logistics | High CAC, Low LTV | Customer Relationships, Revenue Streams | Improved LTV/CAC Ratio |
| Marketplace | Liquidity Issues | Customer Segments, Key Activities | Achieved Liquidity |
| B2B Service | Linear Cost Scaling | Key Resources, Value Proposition | Higher Profit Margins |
| DTC Brand | Channel Dependency | Channels, Cost Structure | Control over Customer Data |
Applying the Canvas to Your Own Venture 🛠️
These case studies illustrate that the Business Model Canvas is not just a planning document; it is a dynamic diagnostic tool. To apply this methodology to your own situation, follow these steps without relying on proprietary software.
- Start with the Customer Segments: Who are you serving? If you cannot name them clearly, the model is flawed.
- Map the Value Proposition: Does this value actually solve the pain point for the segment you identified?
- Align the Channels: How does the customer actually find you? Is this channel efficient?
- Calculate the Economics: Look at the Revenue Streams against the Cost Structure. Is the unit economics positive?
- Review Key Activities & Resources: Do you have the assets to deliver the promise? If not, what is missing?
- Test Assumptions: Treat every block as a hypothesis. Validate it with real data, not opinions.
When a venture is failing, do not just look at the marketing. Look at the Key Partners. Are they reliable? Look at the Customer Relationships. Are they sustainable? The canvas forces you to confront the uncomfortable truths about how the business actually operates versus how it is described in a pitch deck.
Key Takeaways for Founders 🎯
Survival in the startup ecosystem often depends on the ability to adapt quickly. The Business Model Canvas provides the structure needed to make those adaptations deliberate rather than reactive.
- Visualize the Whole: Fragmented thinking leads to failure. The canvas connects the dots between sales, operations, and finance.
- Focus on Value: If the value proposition does not resonate, no amount of marketing will save the business.
- Manage Costs: A strong revenue model is useless if the cost structure is bloated.
- Iterate Relentlessly: The canvas is a living document. It should be updated weekly as assumptions are validated or invalidated.
- Know Your Partners: Supply chain and partnership health are often overlooked until it is too late.
These five stories demonstrate that failure is often a result of structural misalignment, not a lack of effort. By systematically reviewing the nine building blocks, founders can identify the specific levers that need pulling to turn a failing venture into a sustainable one. The canvas does not guarantee success, but it provides the map required to navigate the uncertainty of the market.
For those looking to implement this today, grab a whiteboard and markers. The simplicity of the tool is its strength. It strips away the fluff and leaves only the mechanics of the business. Use it to find the cracks, patch them, and build a foundation that can withstand market shifts.