In the modern business landscape, friction is the silent killer of growth. Customers do not want to fight their way through a purchase process. They expect seamless interactions that respect their time and intent. When obstacles appear, they do not just pause; they leave. To retain loyalty and drive revenue, organizations must identify and remove these friction points systematically. This guide details how to remove barriers using customer journey insights, focusing on the structural and experiential elements that influence user behavior.
Customer journey mapping provides the necessary framework to visualize this experience. It is not merely a diagram; it is a strategic document that reveals the emotional and logical flow of a user. By analyzing this flow, teams can pinpoint exactly where value is lost and where intervention is required. This process requires discipline, empathy, and a commitment to evidence-based decision-making.
Understanding the Foundation of Journey Mapping 🗺️
Before removing barriers, one must understand the terrain. A customer journey map outlines the entire lifecycle of a relationship between a customer and an organization. It captures every touchpoint, channel, and interaction. It moves beyond the transactional view to include the emotional state of the customer at each stage.
Key Components of a Comprehensive Map
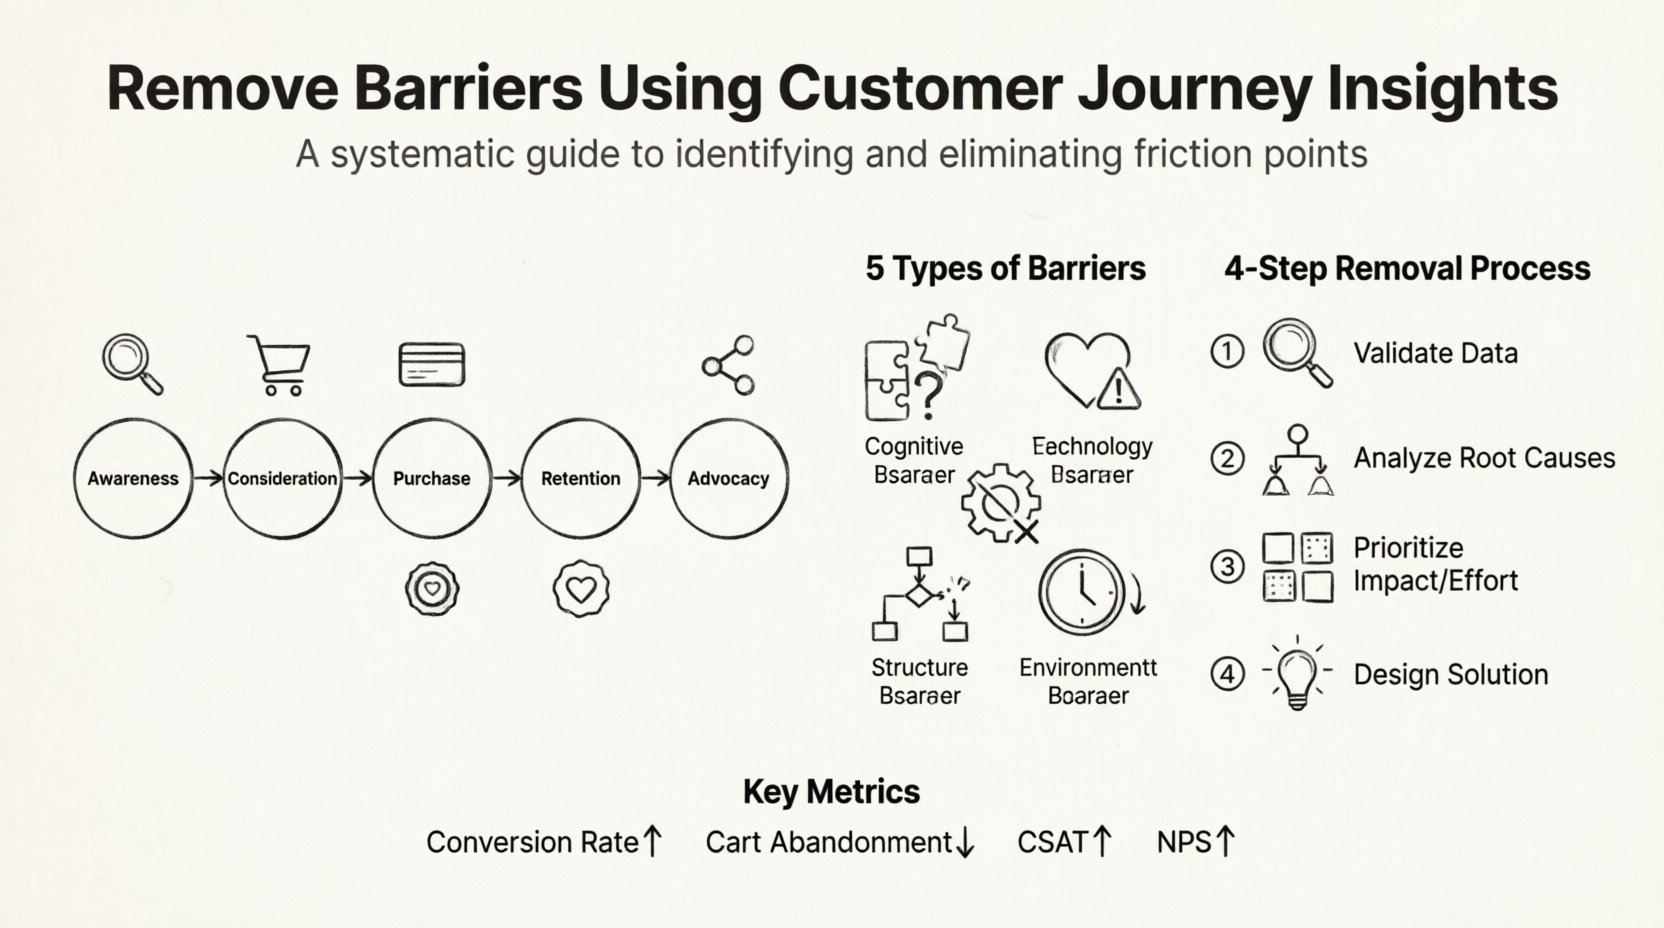
- Phases: The broad stages of the relationship, such as Awareness, Consideration, Purchase, Retention, and Advocacy.
- Touchpoints: Specific interactions where the customer engages with the brand, including websites, support calls, emails, or physical locations.
- Channels: The mediums through which these interactions occur, such as mobile, desktop, social media, or in-person.
- Actions: What the customer is actually doing at each step.
- Thoughts: The cognitive processing happening during the action.
- Emotions: The feelings associated with the experience, ranging from frustration to delight.
Creating this map requires data from multiple sources. It is not enough to rely on internal assumptions. Survey data, customer interviews, support tickets, and analytics must be synthesized to build an accurate representation. Without this factual basis, any attempt to remove barriers will be based on speculation rather than reality.
Identifying the Anatomy of Friction 🔍
Friction is not always obvious. Sometimes it is a broken link; other times, it is a confusing policy. To effectively address these issues, they must be categorized. Understanding the type of barrier helps in selecting the right solution strategy.
Types of Barriers in the Customer Journey
| Barrier Type | Description | Example Scenario |
|---|---|---|
| Cognitive | Confusion or mental effort required to proceed. | Complex form fields that are unclear. |
| Emotional | Fear, anxiety, or lack of trust. | Hidden fees revealed at checkout. |
| Technical | System failures or compatibility issues. | Website crashes during high traffic. |
| Structural | Process inefficiencies or bureaucratic hurdles. | Multiple approvals needed for a simple request. |
| Environmental | External context or timing issues. | Support unavailable during peak hours. |
By classifying barriers, teams can assign ownership to the correct department. Technical issues go to engineering. Emotional concerns often require marketing or service design changes. Structural barriers demand process re-engineering.
The Process of Removing Barriers 🚧
Once barriers are identified, the removal process begins. This is not a one-time event but a cycle of analysis, action, and validation. The following steps outline a robust method for intervention.
1. Validate the Barrier with Data
Assumptions are dangerous. Before proposing a solution, verify that the barrier exists and impacts a significant portion of users. Use quantitative and qualitative data to confirm.
- Quantitative: Drop-off rates in analytics, high bounce rates, or low conversion percentages.
- Qualitative: User interviews, session recordings, or direct feedback from support teams.
If a specific page has a 90% exit rate, that is a signal. However, the reason behind it must be confirmed. Is it the design? The price? The load time? Data validates the existence; research validates the cause.
2. Analyze Root Causes
Surface-level fixes often fail because they do not address the underlying issue. A technique such as the 5 Whys can help drill down to the root cause. If a customer abandons a cart, ask why five times.
- Why did they abandon? The shipping cost was too high.
- Why was it high? The logistics partner charges premium rates.
- Why do they charge premium rates? The delivery window is too narrow.
- Why is the window narrow? The warehouse operates on a specific schedule.
- Why is the schedule fixed? The contract with the warehouse has rigid terms.
The root cause here is the contract term, not the shipping cost itself. Solving the contract issue removes the barrier permanently. Fixing the cost might only work temporarily.
3. Prioritize for Impact and Effort
Resources are finite. Not every barrier can be fixed at once. Use a prioritization matrix to decide where to focus. Evaluate based on two factors: the impact on the customer experience and the effort required to implement the solution.
- High Impact, Low Effort: Address these immediately. These are quick wins that yield significant results.
- High Impact, High Effort: Plan these as strategic projects. They require budget and time.
- Low Impact, Low Effort: Tackle these when capacity allows.
- Low Impact, High Effort: Deprioritize or discard these.
4. Design the Solution
Solutions should be designed with the customer in mind, not the internal workflow. Simplify the path. Reduce the number of steps. Clarify the language. Ensure accessibility. The goal is to make the journey as intuitive as possible.
Consider the following principles:
- Consistency: Ensure the experience is the same across all channels.
- Transparency: Make policies and processes clear and accessible.
- Responsiveness: Ensure systems react quickly to user actions.
- Empathy: Design for human error and stress.
Removing Barriers in Specific Journey Stages 📍
Different stages of the journey present different challenges. A barrier that matters in the Awareness phase may be irrelevant in the Retention phase. Here is a breakdown of common barriers and strategies for specific stages.
Awareness and Discovery
At this stage, customers are looking for solutions. Barriers often relate to finding the information they need.
- Barrier: Poor search functionality.
- Insight: Users cannot find relevant content quickly.
- Action: Improve search algorithms and content tagging.
Barrier: Inconsistent messaging across channels.
Insight: Users feel confused about brand value.
Action: Align messaging guidelines across marketing teams.
Consideration and Evaluation
Customers are comparing options. Friction here often stems from a lack of trust or information.
- Barrier: Lack of social proof.
- Insight: Users hesitate without validation from others.
- Action: Integrate reviews and case studies prominently.
Barrier: Complex pricing structures.
Insight: Users cannot calculate the total cost easily.
Action: Simplify pricing tiers and display total costs upfront.
Purchase and Conversion
This is the critical moment. Barriers here directly result in lost revenue.
- Barrier: Mandatory account creation.
- Insight: Users want to buy quickly without commitment.
- Action: Enable guest checkout options.
Barrier: Limited payment methods.
Insight: Users prefer their specific payment tool.
Action: Add diverse payment gateways.
Retention and Support
After the sale, the relationship continues. Friction here leads to churn.
- Barrier: Difficult cancellation process.
- Insight: Users feel trapped by the system.
- Action: Make self-service cancellation available.
Barrier: Long wait times for support.
Insight: Users need immediate assistance.
Action: Implement chatbots for common queries or expand support hours.
Organizational Alignment for Success 🤝
Removing barriers is not just a task for the digital team. It requires cross-functional collaboration. Silos often create the very barriers customers face. If Sales promises something that Operations cannot deliver, a barrier is created at the handover.
Breaking Down Silos
- Shared Goals: Align KPIs across departments so everyone cares about the same customer outcomes.
- Shared Data: Ensure all teams have access to the same journey data and insights.
- Regular Syncs: Hold meetings where customer feedback is reviewed collectively.
When departments operate in isolation, they optimize for their own metrics, often at the expense of the customer. A unified approach ensures that the journey remains seamless regardless of which department the customer interacts with.
Measuring the Impact of Removal 📊
Once barriers are removed, the results must be measured. Without measurement, there is no proof of success. Key Performance Indicators (KPIs) should be established before changes are made to allow for accurate comparison.
Metrics to Track
| Metric | What it Indicates | Target Improvement |
|---|---|---|
| Conversion Rate | Percentage of users completing the desired action. | Increase by 10-20% |
| Cart Abandonment Rate | Percentage of carts abandoned before purchase. | Decrease by 5-10% |
| Customer Satisfaction Score (CSAT) | Immediate satisfaction after an interaction. | Increase by 5 points |
| Net Promoter Score (NPS) | Loyalty and likelihood to recommend. | Increase by 5-10 points |
| Task Success Rate | Percentage of tasks completed without error. | Increase by 15% |
These metrics should be monitored over time. A single spike in conversion might be due to a seasonal factor, not the barrier removal. Look for sustained trends to confirm the effectiveness of the changes.
Continuous Improvement and Iteration 🔄
Removing barriers is never a finished project. Customer expectations evolve, and technology changes. What works today may create friction tomorrow. Organizations must adopt a mindset of continuous improvement.
Building a Feedback Loop
- Regular Audits: Conduct journey audits quarterly to identify new friction points.
- User Testing: Involve real users in testing new features before launch.
- Feedback Channels: Maintain open lines for customers to report issues.
- Agile Response: Be prepared to pivot quickly when new data emerges.
This cycle ensures that the organization remains responsive to customer needs. It shifts the focus from a one-time fix to a permanent culture of excellence.
Common Pitfalls to Avoid ⚠️
Even with the best intentions, teams can stumble. Awareness of common mistakes helps in avoiding them.
- Focusing on Internal Views: Do not map the journey as the company wants it to be, but as the customer experiences it.
- Ignoring Emotional Data: Logic tells you what happened; emotion tells you why it matters.
- Over-Engineering: Do not add complexity to solve a simple problem. Keep solutions simple.
- Ignoring Mobile: A significant portion of traffic comes from mobile devices. Ensure the journey works perfectly on small screens.
- Stopping at the Sale: The journey does not end at purchase. Post-sale friction causes churn.
Final Considerations for Implementation 🚀
Implementing these changes requires leadership support. Senior management must understand that removing barriers is an investment in long-term value, not just a cost center. Budget allocation should reflect the priority given to customer experience.
Training is also essential. Staff members at all levels need to understand the customer journey. When everyone understands the map, they can contribute to its improvement. A support agent who knows the full journey can anticipate issues better than one who only sees their ticket queue.
Ultimately, the goal is to build trust. Trust is built when customers feel understood and supported. By systematically removing barriers using customer journey insights, organizations create an environment where trust can flourish. This leads to higher retention, increased lifetime value, and organic advocacy.
The path is clear. The tools are available. The data is accessible. The only variable remaining is the commitment to act. Start mapping. Start identifying. Start removing. The results will follow.