Growth is rarely a straight line. It is a complex web of interactions, decisions, and emotional responses that occur between a business and its customers. To scale effectively, organizations must move beyond intuition and adopt a data-driven approach to understanding the customer path. Precision journey mapping provides the structural integrity needed to identify friction, amplify positive experiences, and align internal teams around a unified vision.
This guide explores the methodology of precision journey mapping. It details how to analyze touchpoints, interpret data, and implement changes that result in sustainable expansion. By focusing on the details of the customer experience, companies can build systems that support growth without compromising satisfaction.
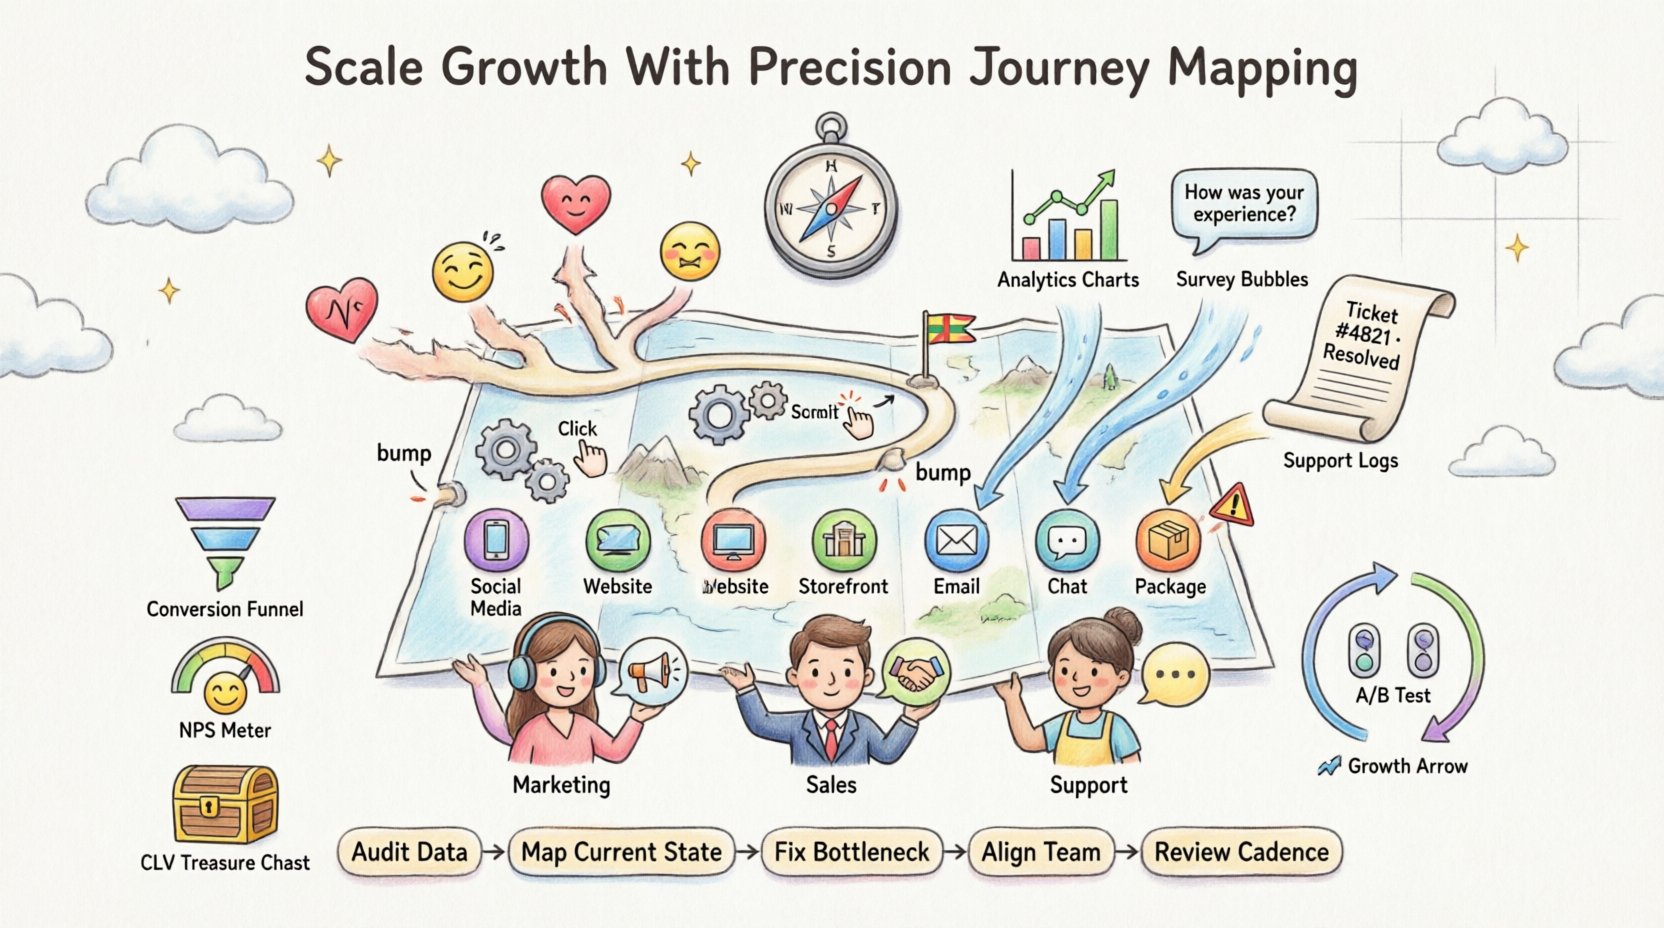
Defining Precision Journey Mapping 🧭
Standard journey mapping often visualizes a linear path. It assumes the customer moves from awareness to purchase in a predictable sequence. Precision journey mapping challenges this assumption. It acknowledges that modern customers navigate non-linear paths across multiple channels. They might research on social media, visit a physical store, and finalize a purchase via a mobile device.
Precision mapping goes deeper than a simple flowchart. It incorporates:
- Emotional States: How does the customer feel at each stage?
- Friction Points: Where does the process slow down or break?
- Context: What external factors influence the decision?
- Feedback Loops: How does the customer communicate issues?
This approach shifts the focus from transactional milestones to holistic experience design. It ensures that every interaction contributes to the overall perception of the brand.
Why Standard Maps Fail at Scale 📉
Many organizations begin with high-level maps. These are useful for initial alignment but often lack the granularity required for scaling. As a business grows, the volume of interactions increases exponentially. A map that worked for 100 customers will likely fail for 10,000.
Common pitfalls in standard mapping include:
- Assumption Bias: Relying on internal beliefs rather than customer data.
- Channel Silos: Treating web, mobile, and in-store experiences as separate entities.
- Static Snapshots: Creating a map once and never updating it.
- Ignoring Negative Paths: Focusing only on the “happy path” where everything goes right.
Scaling requires resilience. The customer journey must be robust enough to handle increased traffic, diverse user behaviors, and changing market conditions. Precision mapping addresses these challenges by treating the journey as a living system.
The Core Framework for Precision 🛠️
Building a precision map requires a structured methodology. It is not enough to gather ideas; the process must be systematic. The following framework outlines the essential components of a high-fidelity journey map.
1. Data Aggregation and Validation
Before drawing any lines, you must understand the reality of the current state. Data comes from multiple sources. Quantitative data shows what is happening. Qualitative data explains why it is happening.
Key data sources include:
- Transactional Records: Purchase history, cart abandonment rates, and return frequencies.
- Support Logs: Common issues reported to customer service teams.
- Behavioral Analytics: Click streams, time on page, and navigation paths.
- Direct Feedback: Surveys, interviews, and user testing sessions.
Validation is critical. Data can be misleading if not cross-referenced. A drop-off in a funnel might indicate a technical error, or it might indicate a pricing objection. Only by combining behavioral data with direct feedback can you determine the root cause.
2. Persona Segmentation
One journey does not fit all. Scaling a business often involves targeting different market segments. Each segment may have distinct motivations and constraints. A precision map accounts for these variations.
Consider segmenting your journey by:
- Demographics: Age, location, and income level.
- Behavioral Patterns: Frequency of purchase and average order value.
- Intent: Browsing for information versus ready to buy.
Creating specific personas for each segment ensures that the journey map remains relevant. For example, a new user might need education and trust-building. A returning user might need speed and convenience. The map must reflect these differing needs.
3. Touchpoint Inventory
A touchpoint is any interaction between the customer and the brand. These can be physical, digital, or human. In a precision map, every touchpoint is cataloged and analyzed.
Common touchpoints include:
- Search engine results
- Social media posts
- Email newsletters
- Website product pages
- Customer support chats
- Physical packaging
- Post-purchase follow-ups
For each touchpoint, you must define the channel, the owner, the objective, and the current performance metric. This inventory serves as the backbone of the mapping process.
Standard vs. Precision Journey Mapping ⚖️
Understanding the difference between traditional approaches and precision mapping is vital for strategic planning. The table below highlights the key distinctions.
| Feature | Standard Mapping | Precision Mapping |
|---|---|---|
| Scope | Linear, single channel | Non-linear, omnichannel |
| Data Source | Assumptions and surveys | Real-time analytics and logs |
| Updates | Annual or event-based | Continuous and iterative |
| Focus | Process efficiency | Customer emotion and outcome |
| Scalability | Low | High |
| Team Alignment | Marketing focused | Cross-functional |
Emotional and Functional Layers 🧠
A complete journey map overlays two distinct layers: the functional layer and the emotional layer.
The Functional Layer
This layer tracks the actions the user takes. It answers the question, “What did the user do?” It includes clicks, form submissions, and navigation steps. This is the visible skeleton of the journey.
The Emotional Layer
This layer tracks the user’s internal state. It answers the question, “How did the user feel?” Emotions fluctuate throughout the journey. A user might feel excited at the beginning, anxious during checkout, and relieved after delivery.
Mapping emotions requires empathy. It involves asking users about their stress levels, confidence, and satisfaction at specific moments. This data often reveals issues that functional data misses. For instance, a checkout process might be technically functional, but if it causes anxiety, users will abandon it.
Implementation Steps for Optimization 🚀
Once the map is created, the focus shifts to optimization. This is where precision mapping drives growth. The following steps outline the optimization cycle.
Step 1: Identify High-Impact Friction
Not all friction points are created equal. Some minor annoyances do not significantly impact conversion. Others cause complete drop-offs. Prioritization is key.
To identify high-impact friction:
- Look for the highest drop-off rates in the data.
- Correlate friction points with negative feedback.
- Assess the volume of traffic affected by the issue.
- Consider the revenue at risk for each point.
Focus your resources on the top three friction points. Solving these will yield the quickest return on investment.
Step 2: Redesign Touchpoints
With the friction points identified, redesign the specific interactions. This might involve simplifying forms, clarifying copy, or improving load times.
Guidelines for redesign include:
- Clarity: Ensure the purpose of every element is obvious.
- Consistency: Maintain visual and tonal consistency across channels.
- Accessibility: Ensure the experience works for users with disabilities.
- Speed: Minimize the time required to complete actions.
Step 3: Implement A/B Testing
Changes should not be rolled out blindly. Use controlled testing to validate improvements. A/B testing allows you to compare a variation against the control.
This process ensures that modifications actually improve the experience. It removes guesswork from the optimization phase. If a change does not statistically improve the metric, revert it.
Step 4: Monitor and Iterate
The journey is never finished. Customer behaviors evolve. New competitors enter the market. Technology changes. The map must be updated regularly.
Establish a schedule for review. Quarterly reviews are common, but high-traffic businesses may need monthly updates. Continuous monitoring ensures the strategy remains aligned with reality.
Measuring Success: KPIs and Metrics 📊
To validate the effectiveness of precision journey mapping, you must track specific key performance indicators. These metrics provide evidence of growth and efficiency.
Primary Metrics
- Conversion Rate: The percentage of users who complete a desired action.
- Customer Acquisition Cost (CAC): The cost to acquire a new customer.
- Customer Lifetime Value (CLV): The total revenue expected from a customer.
- Churn Rate: The percentage of customers who stop using the service.
Experience Metrics
- Net Promoter Score (NPS): Likelihood of recommending the brand.
- Customer Satisfaction Score (CSAT): Satisfaction with a specific interaction.
- Task Success Rate: Percentage of users who complete a task without error.
- Time on Task: Duration taken to complete a specific goal.
Aligning these metrics with journey stages allows for precise attribution. You can see exactly which part of the journey is driving value and which part is causing leakage.
Common Pitfalls to Avoid 🚫
Even with a solid framework, errors can occur. Being aware of common mistakes helps maintain the integrity of the mapping process.
- Ignoring Internal Barriers: Sometimes the friction is not with the customer, but with the employee tools. Ensure internal workflows support the customer journey.
- Over-Optimizing: Do not optimize every single pixel. Focus on the big picture. Perfectionism can stall progress.
- Siloed Teams: If marketing, sales, and support do not share the map, alignment fails. Ensure all departments have access to the data.
- Static Thinking: Do not treat the map as a finished document. It is a working tool.
The Role of Feedback Loops 🔁
A precision map relies on feedback loops to stay accurate. These loops connect the customer directly to the product and service teams.
Effective feedback mechanisms include:
- In-App Surveys: Short questions triggered at specific moments.
- Exit Intent Popups: Asking why a user is leaving.
- User Interviews: Deep dives into specific behaviors.
- Social Listening: Monitoring brand mentions and sentiment.
These inputs feed back into the mapping process. They allow the organization to adapt quickly to changes in customer sentiment. This agility is a competitive advantage in scaling environments.
Future-Proofing Your Strategy 🔮
As technology evolves, so do customer expectations. Precision journey mapping must anticipate these shifts.
Emerging trends to consider:
- Predictive Analytics: Using data to forecast future behaviors.
- Personalization at Scale: Delivering unique experiences to large audiences.
- Automation: Using logic to handle routine interactions.
- Privacy Compliance: Ensuring data collection respects user rights.
Building a foundation of precision today prepares the organization for these developments. The core principle remains the same: understand the customer deeply.
Actionable Takeaways ✅
To move forward with precision journey mapping, consider the following immediate actions:
- Audit Current Data: Gather all available behavioral and feedback data.
- Map the Current State: Document how customers actually move, not how you think they move.
- Identify One Bottleneck: Find one major friction point to fix immediately.
- Align Stakeholders: Ensure all departments understand the map.
- Set a Review Cadence: Schedule regular updates to the journey map.
Growth is a byproduct of a superior experience. By investing in the precision of your journey mapping, you create a system that supports expansion. This approach reduces waste, increases retention, and builds a brand that customers trust.
Start with the data. Build the map. Optimize the experience. Scale the results.