Systems design requires more than just visualizing static structures. It demands a clear understanding of dynamic behavior, control flow, and the orchestration of complex interactions. While Sequence Diagrams excel at showing message exchanges between objects over time, they often struggle to represent high-level control logic, branching paths, or decision points across multiple lifelines. This is where the UML Interaction Overview Diagram (IOD) becomes an essential tool for architects and engineers.
An Interaction Overview Diagram acts as a bridge between high-level Activity Diagrams and detailed Sequence Diagrams. It allows you to model the flow of control through a system while delegating the specific communication details to other diagrams. In this guide, we will explore the anatomy, utility, and construction of IODs to enhance your modeling capabilities. 🧩
What is an Interaction Overview Diagram? 🤔
An Interaction Overview Diagram is a specialized type of interaction diagram in the Unified Modeling Language (UML). It is essentially a hybrid structure. It combines the control flow elements of an Activity Diagram with the interaction elements of a Sequence or Communication Diagram. The primary purpose is to show how control passes from one interaction to another.
Think of an Activity Diagram as a map of the roads and intersections in a city. It tells you where you go next. Now, imagine that each intersection is actually a complex tunnel system (a Sequence Diagram). The IOD maps the journey from tunnel to tunnel. It answers the question: “If condition A happens, which sequence of events occurs next?”
Key characteristics include:
- Control Flow Focus: It emphasizes the order of operations rather than individual messages.
- Delegation: It references other interaction diagrams to avoid cluttering the view with low-level details.
- Modularity: It allows complex logic to be broken down into manageable interaction fragments.
- Visual Clarity: It provides a high-level view that is easier to understand than a sprawling Activity Diagram with embedded objects.
Core Components and Symbols 🛠️
To construct a valid Interaction Overview Diagram, you must understand the specific notation used. The diagram relies on two main sets of symbols: those inherited from Activity Diagrams for control flow, and those from Interaction Diagrams for execution nodes.
1. Control Flow Nodes
These define the path the system takes through the logic. They are similar to those found in standard Activity Diagrams.
- Initial Node: A solid black circle. This marks the starting point of the interaction flow.
- Final Node: A solid black circle with a border. This indicates the successful termination of the flow.
- Decision Node: A diamond shape. It represents a point where the flow splits based on a condition (e.g., boolean checks).
- Merge Node: Also a diamond shape, but used to combine multiple incoming paths into a single outgoing path.
- Fork Node: A horizontal or vertical bar. It splits a single flow into multiple concurrent flows that execute in parallel.
- Join Node: Also a bar. It waits for all incoming concurrent flows to complete before continuing.
2. Interaction Nodes
These are the heart of the IOD. They represent a specific interaction, usually defined in a separate Sequence Diagram.
- Interaction Occurrence: A rectangle with the label “Interaction”. Inside, you place the name of the referenced Sequence Diagram or Communication Diagram.
- Execution Specification: Similar to an Activity Node, but specifically for interactions. It often appears as a rectangle containing the interaction name.
3. Edges and Transitions
Lines connect the nodes to define the sequence. You can label these edges with guard conditions (e.g., “User Logged In”) to clarify decision points.
Interaction Overview vs. Activity Diagrams 🔄
Confusion often arises between Interaction Overview Diagrams and Activity Diagrams because they share control flow semantics. However, their intent and granularity differ significantly. Understanding when to use which is critical for effective systems design.
| Feature | Activity Diagram | Interaction Overview Diagram |
|---|---|---|
| Primary Focus | Workflow and business logic steps | Control flow between interactions |
| Detail Level | Can range from high-level to detailed actions | High-level orchestration of message exchanges |
| Interaction Detail | Messages are often implicit or summarized | Explicitly references Sequence/Communication Diagrams |
| Concurrency | Strong support for parallel activities | Supports concurrent interaction execution |
| Best Use Case | Business processes, state transitions | System architecture, API orchestration |
When your system relies heavily on message passing between components (like microservices or object-oriented architectures), the IOD is often more appropriate. It keeps the focus on the interactions rather than the internal actions of the objects involved.
Integrating Sequence Diagrams 📑
The true power of the Interaction Overview Diagram lies in its ability to link with Sequence Diagrams. This creates a hierarchical modeling approach. You do not draw every message on the IOD. Instead, you define the flow of the conversation.
The Reference Mechanism
When you place an interaction occurrence node on the IOD, it points to a specific Sequence Diagram. This Sequence Diagram contains the details of what happens during that specific phase of the overview.
For example:
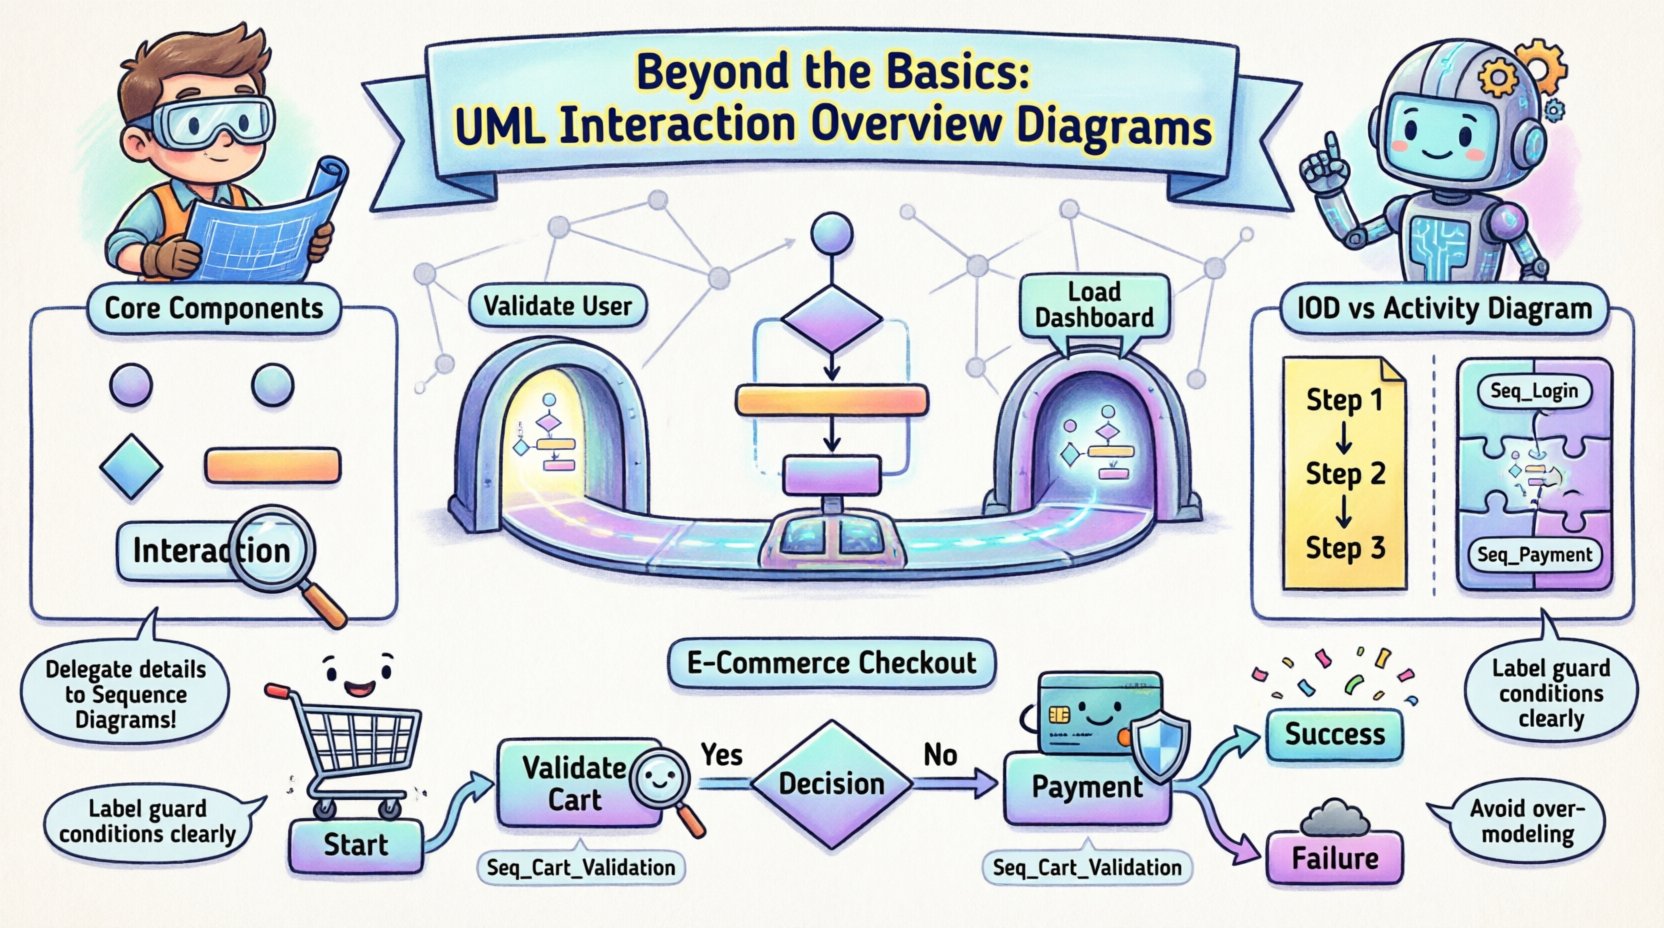
- Start: The IOD begins with an Initial Node.
- Step 1: An Interaction Occurrence labeled “Validate User” references SequenceDiagram_A.
- Decision: A Decision Node checks the result of the validation.
- Path A: If valid, flow moves to Interaction Occurrence “Load Dashboard” referencing SequenceDiagram_B.
- Path B: If invalid, flow moves to Interaction Occurrence “Show Error” referencing SequenceDiagram_C.
This structure prevents the IOD from becoming a massive web of lines. It keeps the high-level architecture clean while ensuring all logical paths are accounted for.
When to Use Interaction Overview Diagrams 🎯
You should consider incorporating IODs into your documentation when specific conditions are met. They are not a silver bullet for every situation, but they shine in complex scenarios.
- Complex Orchestration: When a process involves calling multiple different services or components in a specific order.
- Conditional Logic: When the system behavior changes drastically based on input states (e.g., different API calls for Premium vs. Free users).
- Parallel Processing: When multiple actions must happen simultaneously before the system can proceed (e.g., sending an email and logging an audit trail at the same time).
- Reusability: When the same interaction sequence is used in multiple parts of the system, referencing it keeps the diagrams consistent.
- System Integration: When designing how external systems communicate with internal modules.
Conversely, avoid using IODs for simple linear flows. If a process only has one path from start to finish, a Sequence Diagram or a simple list of steps is more efficient. Do not add complexity where none exists.
Constructing an Effective Diagram 📐
Creating a professional-grade Interaction Overview Diagram requires adherence to specific modeling standards. Follow these guidelines to ensure your diagrams are maintainable and understandable.
1. Define Scope Clearly
Decide the boundaries of the interaction. Is this diagram covering the entire login process, or just the password reset flow? Keep the scope narrow enough to be readable but wide enough to be useful.
2. Standardize Interaction References
Always name your referenced Sequence Diagrams consistently. If you label a node “Check Inventory”, ensure the linked Sequence Diagram has a title that matches or clearly describes that action. This reduces cognitive load for the reader.
3. Manage Decision Paths
Ensure every Decision Node has at least two outgoing edges. One for true, one for false (or other outcomes). If a path is missing, the flow is incomplete. Label every edge with a clear guard condition, such as “Status = Active” or “Error Code = 404”.
4. Handle Concurrency Properly
When using Fork and Join nodes, ensure the logic is sound. Do not join flows that are logically incompatible. For instance, do not merge a “Success” path with a “Timeout” path unless there is a specific recovery mechanism defined in the subsequent interaction.
5. Maintain Hierarchy
Do not nest IODs inside IODs. If a logic path becomes too complex, create a new, separate Interaction Overview Diagram for that specific sub-process and reference it. This is similar to breaking down a large class into smaller classes.
Common Pitfalls and How to Avoid Them ⚠️
Even experienced modelers can fall into traps when designing these diagrams. Recognizing these issues early saves time during development and maintenance.
- Over-Modeling: Trying to show every single message on the IOD. Remember, the IOD is for flow, not for message exchange details. Keep it high-level.
- Circular References: Avoid referencing an interaction that eventually references back to the original IOD. This creates infinite loops in the model and confuses the logic.
- Inconsistent Notation: Mixing Activity Diagram symbols with Interaction Diagram symbols incorrectly. Stick to the UML specification for Interaction Overview nodes.
- Missing Error Paths: Focusing only on the “Happy Path” (where everything works). A robust design must account for failures, timeouts, and exceptions.
- Vague Labels: Using labels like “Process Data” without specifying what that entails. Be specific, e.g., “Validate Input” or “Commit Transaction”.
Example Scenario: E-Commerce Checkout 🛒
To illustrate the practical application, consider an e-commerce checkout process. This scenario involves validation, payment processing, inventory checks, and notifications.
High-Level Flow:
- Start: Customer initiates checkout.
- Validate Cart: Checks if items are in stock and prices are valid. (Linked to Seq_Cart_Validation).
- Decision: Are items valid?
- Yes: Proceed to Payment.
- No: Show Error Message. (Linked to Seq_Error_Display).
- Payment: Process transaction. (Linked to Seq_Payment_Gateway).
- Decision: Was payment successful?
- Yes: Update Inventory and Send Confirmation. (Linked to Seq_Order_Processing).
- No: Retry or Cancel. (Linked to Seq_Payment_Failure).
- End: Order Complete.
In this example, the IOD does not show the credit card number being sent or the database query for stock. It simply orchestrates the sequence of interactions required to move from cart to confirmation. This allows the team to focus on the logic flow without getting bogged down in data transmission details.
Best Practices for Maintenance 📋
Diagrams are living documents. They evolve as the system changes. To keep your Interaction Overview Diagrams valuable over time, follow these maintenance practices.
- Version Control: Treat your diagram files like code. Use version control systems to track changes. This helps you revert if a logic change breaks the flow.
- Documentation Links: Ensure every referenced Sequence Diagram is also documented. An IOD pointing to a missing or outdated Sequence Diagram is useless.
- Regular Reviews: During sprint planning or architecture reviews, examine the IODs. Do they still match the implemented code? If the logic has changed, update the diagram immediately.
- Naming Conventions: Adopt a strict naming convention for nodes. For example, “Action: [Verb] [Object]”. This makes scanning the diagram faster.
- Tooling Consistency: Use the same modeling tool for all diagrams in a project. This ensures compatibility when linking diagrams together.
The Role of IODs in Agile Development 🚀
Even in Agile environments where documentation is often minimized, Interaction Overview Diagrams serve a vital purpose. They act as a shared language between developers, testers, and business analysts.
During the planning phase, a team can sketch an IOD to agree on the flow before writing code. This reduces the risk of misunderstanding requirements. During testing, QA engineers can use the IOD to ensure all paths (including error paths) are covered by test cases. The diagram becomes a checklist for coverage.
It is important to remember that in Agile, diagrams should be lightweight. Do not spend weeks refining a diagram. Create the IOD just enough to clarify the logic, then move to implementation. Update the diagram only when the logic changes significantly. This approach balances the need for clarity with the need for speed.
Advanced Considerations: State and Timing ⏱️
While the primary function of an IOD is control flow, advanced modeling may require considering state and timing constraints.
State Awareness: Sometimes, an interaction depends on the current state of the system. You can annotate interaction nodes to indicate required pre-conditions (e.g., “Requires State: Logged In”). This ensures the Sequence Diagram referenced is executed only when the system is in a valid state.
Timing Constraints: If an interaction must happen within a specific timeframe (e.g., a timeout on a payment gateway), you can add a note to the edge or node specifying the time limit. While IODs are not Timing Diagrams, they can reference timing constraints that the underlying Sequence Diagram must respect.
These advanced features require careful handling. Overloading an IOD with timing details can make it unreadable. Keep timing logic within the referenced Sequence Diagrams where possible, and use the IOD only to indicate that a time-sensitive interaction is occurring.
Summary of Implementation 📝
Interaction Overview Diagrams are a powerful component of the UML suite. They provide the necessary bridge between high-level workflow and detailed message exchange. By using IODs, system architects can design complex systems with clarity and precision.
Key takeaways include:
- Hybrid Nature: They combine Activity Diagram flow with Interaction Diagram content.
- Modularity: They allow you to break complex flows into referenced Sequence Diagrams.
- Clarity: They simplify the visualization of conditional logic and branching paths.
- Maintenance: They require version control and regular updates to remain accurate.
By mastering the construction and application of Interaction Overview Diagrams, you enhance the quality of your systems design documentation. This leads to better communication among team members and a more robust software architecture. Focus on the flow, delegate the details, and ensure your models reflect the reality of your system’s operation.