In the world of software development, Unified Modeling Language (UML) provides a standardized way to visualize the design of a system. One of the key diagrams in UML is the Object Diagram, which offers a snapshot of the instances within a system at a specific point in time. This article will introduce you to Object Diagrams, explain their purpose, and guide you through creating them using Visual Paradigm, a powerful UML modeling tool.

What is an Object Diagram?
An Object Diagram is a type of UML diagram that shows a static view of a system by illustrating the instances of classes and their relationships at a particular moment. Unlike Class Diagrams, which provide a blueprint of the system’s structure, Object Diagrams focus on the actual objects that exist at runtime and their interactions.
Key Features
- Snapshot View: Object Diagrams capture the state of the system at a specific time, providing a real or prototypical perspective.
- Instance-Based: They focus on instances (objects) rather than classes, showing how objects interact with specific attribute values.
- Static Design: While they depict a moment in time, Object Diagrams are used to illustrate the static design of a system, helping to understand how objects relate to each other in a given scenario.
Why Use Object Diagrams?
- Testing and Debugging: Object Diagrams are valuable for testing and debugging as they show how objects interact in real-time scenarios.
- Scenario Illustration: They help in visualizing specific use cases or scenarios, making it easier to understand the system’s behavior under certain conditions.
- Prototyping: Object Diagrams can be used to prototype how a system will behave with actual data, aiding in the design process.
Creating Object Diagrams with Visual Paradigm
Visual Paradigm is a comprehensive tool for UML modeling, including the creation of Object Diagrams. Here’s a step-by-step guide to help you get started:
Step-by-Step Guide
-
Create a New Object Diagram:
- Open Visual Paradigm and select
Diagram > Newfrom the application toolbar. - In the
New Diagramwindow, selectObject Diagram.
- Open Visual Paradigm and select
-
Create Instance Specifications:
- From the diagram toolbar, select
Instance Specificationand click on the diagram to create the shape. - Name the instance specification according to the object it represents.
- From the diagram toolbar, select
-
Select Classifiers:
- Right-click on the instance specification shape and select
Select Classifier > Select Classifier...from the pop-up menu. - In the
Select Classifierwindow, choose the class(es) that will serve as the classifier for the instance specification.
- Right-click on the instance specification shape and select
-
Define Slots:
- To define slots, right-click the instance specification shape and select
Slots...from the pop-up menu. - In the
Instance Specification Specificationwindow, select the features to define slots and clickDefine Slot. - Edit the values of the slots by selecting a defined slot and clicking
Edit Values....
- To define slots, right-click the instance specification shape and select
-
Create Links:
- To create links between instance specifications, move the mouse pointer over the source instance specification.
- Press the Resource Catalog button and drag it out to the target instance specification.
- Release the mouse button and select
Linkfrom the Resource Catalog to create a link.
Example
Let’s consider a simple example of a library system:
- Classes:
Book,Member,Loan - Objects:
Book: “1984” by George OrwellMember: Jane DoeLoan: Loan record for Jane Doe borrowing “1984”
Steps to Model This in Visual Paradigm:
-
Create Instance Specifications:
- Create instances for
Book,Member, andLoan.
- Create instances for
-
Select Classifiers:
- Assign the respective classes (
Book,Member,Loan) to each instance.
- Assign the respective classes (
-
Define Slots:
- For
Book: Define slots fortitle,author, and set values like “1984” and “George Orwell”. - For
Member: Define slots fornameand set the value to “Jane Doe”. - For
Loan: Define slots forloanDateandreturnDate.
- For
-
Create Links:
- Create a link between
Member(Jane Doe) andLoanto show that Jane Doe has borrowed a book. - Create a link between
LoanandBookto show that “1984” is the book borrowed.
- Create a link between
Example: Class Diagram vs Object Diagram
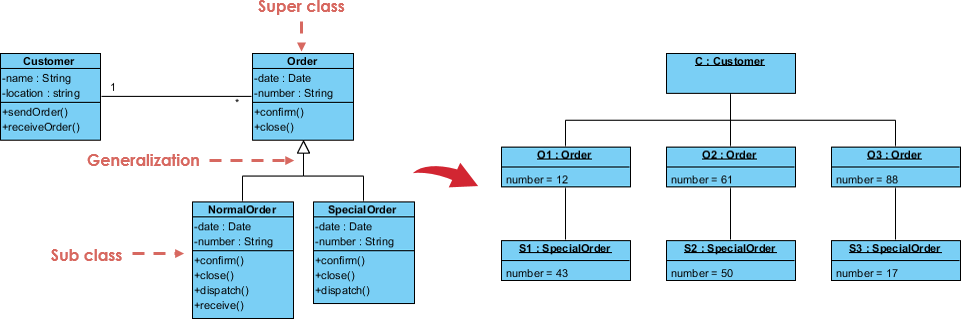
The image illustrates the concepts of class and object diagrams in object-oriented programming, focusing on the relationships between classes and their instances (objects). Here’s a detailed explanation:
Class Diagram (Left Side)
-
Classes and Attributes:
- Customer Class:
- Attributes:
name(String),location(String). - Methods:
+sendOrder(),+receiveOrder().
- Attributes:
- Order Class:
- Attributes:
date(Date),number(String). - Methods:
+confirm(),+close().
- Attributes:
- Customer Class:
-
Generalization (Inheritance):
- The
Orderclass is a superclass that is generalized into two subclasses:NormalOrderandSpecialOrder. - NormalOrder Class:
- Inherits attributes and methods from
Order. - Additional Methods:
+dispatch(),+receive().
- Inherits attributes and methods from
- SpecialOrder Class:
- Inherits attributes and methods from
Order. - Additional Methods:
+dispatch().
- Inherits attributes and methods from
- The
-
Relationships:
- There is a one-to-many relationship between
CustomerandOrder, indicated by the “1” on theCustomerside and no number on theOrderside, meaning one customer can have multiple orders.
- There is a one-to-many relationship between
Object Diagram (Right Side)
-
Objects and Attributes:
- C1: Customer Object:
- An instance of the
Customerclass.
- An instance of the
- O1, O2, O3: Order Objects:
- Instances of the
Orderclass with specificnumberattributes:O1(number = 12),O2(number = 61),O3(number = 88).
- Instances of the
- S1, S2, S3: SpecialOrder Objects:
- Instances of the
SpecialOrderclass with specificnumberattributes:S1(number = 43),S2(number = 50),S3(number = 17).
- Instances of the
- C1: Customer Object:
-
Relationships:
- The
C1customer object is linked to multiple order objects (O1,O2,O3) and special order objects (S1,S2,S3). - This reflects the one-to-many relationship shown in the class diagram, where a single customer can have multiple orders.
- The
Interpretation
- Generalization: The
Orderclass serves as a base class with common attributes and methods, whileNormalOrderandSpecialOrderare specialized versions with additional functionality. - Instantiation: The object diagram shows how these classes are instantiated into specific objects with concrete values, demonstrating how the class structure is utilized in practice.
- Relationships: The diagrams emphasize the associations between customers and their orders, illustrating how objects interact based on the defined class relationships.
This visualization helps in understanding how classes are designed and how they translate into real-world objects with specific data and behaviors.
Conclusion
Object Diagrams are a powerful tool in UML for visualizing the runtime behavior of a system through specific instances and their interactions. By using Visual Paradigm, you can efficiently create these diagrams, aiding in the design, testing, and debugging of your software systems. Whether you’re a beginner or an experienced developer, understanding and utilizing Object Diagrams can significantly enhance your ability to model and understand complex systems.
References
- Drawing Object Diagrams. Visual Paradigm
- Learning Class Diagrams with Visual Paradigm. Archimetric
- Visual Paradigm Tutorial. Retrieved from YouTube
- Example: Class Diagram vs Object Diagram. Visual Paradigm Circle
- Class Diagrams vs Object Diagrams in UML. Visual Paradigm
- What is Object Diagram? Visual Paradigm
- Object Diagram. Visual Paradigm
- UML Class Diagram Tutorial. Visual Paradigm