


Uncovering why things go wrong doesn’t need to be painful. High employee turnover, production delays, quality drops, missed deadlines — describe the problem in plain words, and Visual Paradigm’s AI Fishbone (Ishikawa) Diagram Generator builds a clear, structured cause-and-effect model instantly. No more blank-canvas frustration. Just fast, logical insights that get teams aligned and solutions moving.
This smart tool automatically organizes causes into classic categories (People, Process, Equipment, Materials, Environment, Management — the 6Ms), making root cause analysis feel effortless and professional.
Why Teams Love This AI Fishbone Tool
- Text description → complete Fishbone diagram in seconds
- Smart auto-categorization into standard 6M branches
- Deep sub-causes identified from your description
- Fully editable native model — tweak, expand, color-code
- Desktop depth + browser chatbot for quick sessions
1. Desktop: From Problem Statement to Structured Diagram
In Visual Paradigm Desktop:
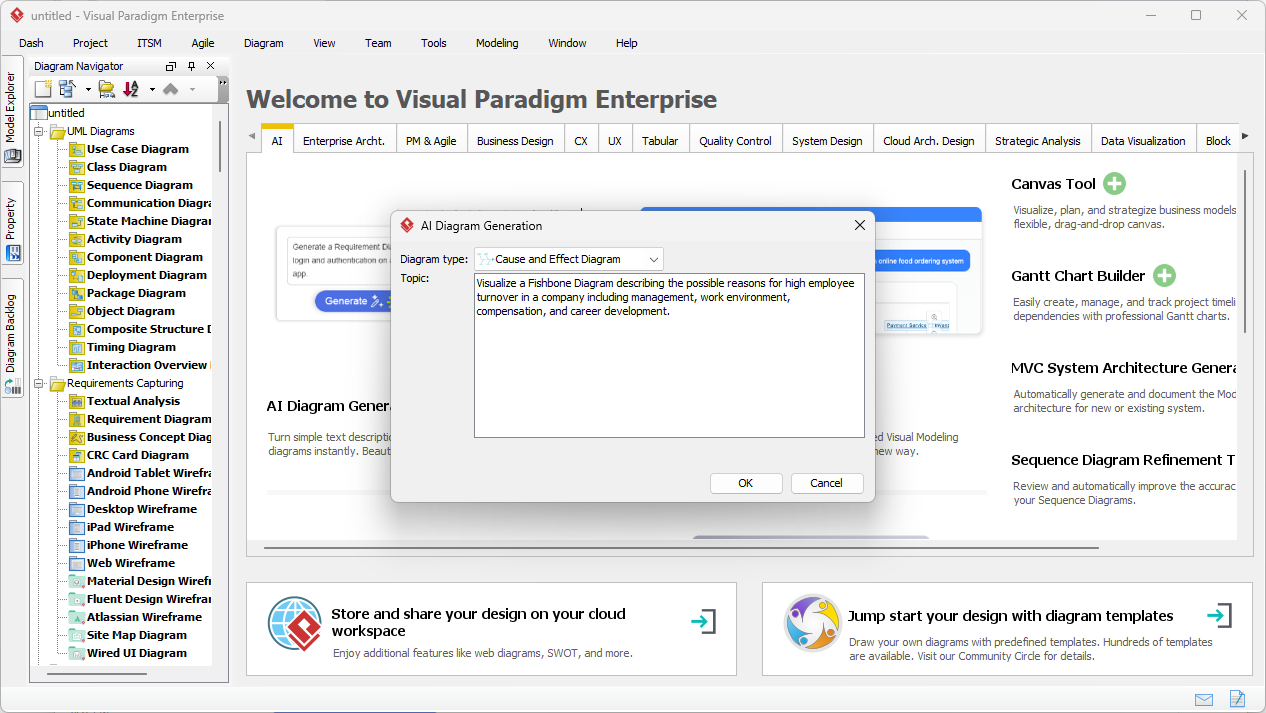
Tools → AI Diagram Generation → select “Cause and Effect Diagram” (Fishbone) → describe the issue:
“Analyze high employee turnover in a tech company. Include factors related to management style, compensation, work environment, career growth opportunities, workload, and company culture.”
The prompt window keeps it simple:
AI analyzes and delivers:
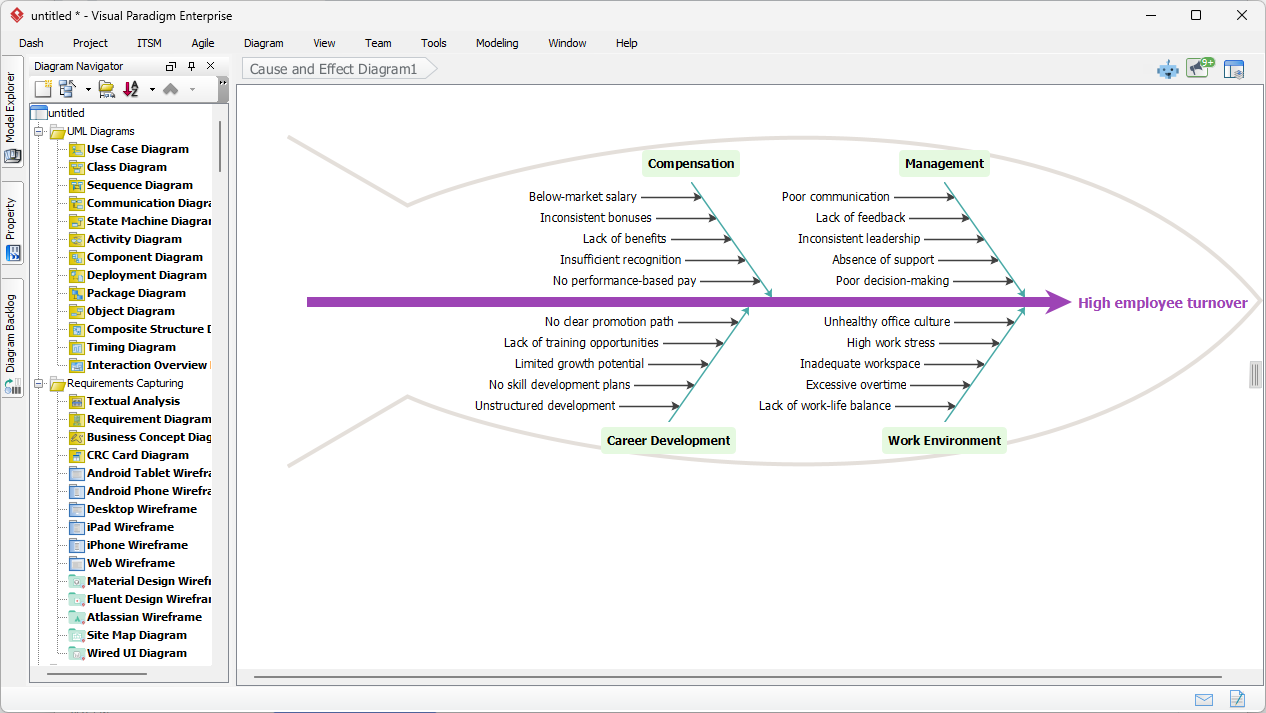
- Head: High Employee Turnover
- Main bones: Compensation, Management, Career Development, Work Environment
- Sub-causes: Poor communication, Below-market salary, Lack of feedback, Heavy workload, Limited advancement
Here’s the generated high employee turnover Fishbone diagram — clean, hierarchical, and ready for discussion:
Refine instantly: add more causes, change categories, highlight priorities, export for reports or Kaizen events.
2. Chatbot: Quick Brainstorming Anywhere
For rapid sessions or remote teams, use the Visual Paradigm AI Chatbot in your browser:
“Create Fishbone diagram for production delays in manufacturing: issues with machines, suppliers, staff training, scheduling, maintenance, and raw materials.”
The chatbot builds it live — main problem at the head, branches for each category, sub-causes populated intelligently. Refine by replying: “Add quality control as a new branch.” Instant update.
Perfect for stand-ups, retrospectives, or when inspiration strikes away from your desk.
Real Power of Fishbone + AI in 2026
Traditional root cause analysis takes hours of whiteboarding and debate. This AI handles the structure so you can focus on:
- Deep discussion of real issues
- Prioritizing causes (Pareto, voting)
- Building action plans
- Preventing recurrence
Change the problem statement mid-session? Regenerate. New factor emerges? Add it. That agility makes continuous improvement faster and more collaborative than ever.
Ready to Uncover Hidden Causes?
Visual Paradigm’s AI Fishbone Diagram Generator makes Ishikawa diagrams fast, accurate, and beautiful — whether for quality control, project recovery, or process excellence.
- Download Visual Paradigm Desktop → Full power for serious analysis: Get Desktop Now
- Try AI Chatbot Online → Instant root cause visuals: Start Chatting
Stop guessing at problems. Start solving them with clarity — today.
Related Links
The integration of artificial intelligence into fishbone (Ishikawa) diagrams allows organizations to automate the identification of root causes for complex business and operational problems. These articles demonstrate how AI-powered generators transform natural language text into structured visual models, often integrating other techniques like the 5 Whys to enhance quality management. By utilizing automated tools and specialized templates, teams can conduct faster and more accurate cause-and-effect analysis to improve overall project outcomes.
- Announcement: AI Fishbone Diagram Generator Launch: This official release introduces an AI-powered generator designed to facilitate faster and more accurate root cause analysis.
- AI Fishbone Diagram Generator Tool: This dedicated platform automatically creates Ishikawa diagrams to help teams solve complex problems through intelligent automation.
- AI-Powered Fishbone Diagram Generator – Uncover Root Causes in Seconds: This article explains how the automated generator speeds up decision-making processes by quickly identifying critical issues within a system.
- Create Fishbone Diagrams from Text Using Visual Paradigm Smart Board: This guide provides instructions on using a collaborative smart board to generate diagrams directly from natural language text input.
- Fishbone Analysis: Ishikawa Diagram Concepts and AI-Powered Tools: This case study explores core concepts of Ishikawa diagrams and the specific role AI tools play in modern quality management and problem-solving.
- Fishbone Diagram and 5 Whys Integration: This resource details how to combine fishbone diagrams with the 5 Whys technique to deepen root cause analysis in project management.
- Unraveling Complex Issues: The Power of Cause and Effect Analysis: This article illustrates how structured cause-and-effect analysis helps resolve business and operational bottlenecks effectively.
- How to Create a Fishbone Diagram: A Step-by-Step Guide: This comprehensive tutorial provides a structured approach for identifying problems in various processes and technical systems.
- Fishbone (Ishikawa) Diagram Template – Ready-to-Use: This resource offers access to customizable templates that allow teams to begin analyzing cause-and-effect relationships instantly.
- Fishbone Diagram Template for Product Defects Analysis: This specialized template is designed for manufacturing and quality assurance teams to systematically analyze product defects and operational failures.