


Introduction to AI-Assisted Modeling
In the rapidly evolving landscape of system architecture and software design, the traditional “blank canvas” has long been a bottleneck. Starting a complex diagram from scratch—manually dragging, dropping, connecting, and aligning elements—is often a tedious process that creates a significant delay between conceptual brainstorming and actual visual documentation. Visual Paradigm has addressed this critical workflow challenge with the introduction of the AI Diagram Generator.
Released initially in November 2025, with major updates following in December, this feature leverages artificial intelligence to transform simple text prompts into professional, fully editable diagrams. This guide provides a comprehensive look at how to utilize this tool to streamline modeling workflows, covering everything from basic UML structures to complex data visualization with Radar Charts.
Key Concepts
Before diving into the operational steps, it is essential to understand the foundational concepts behind this technology and how it alters the traditional modeling approach.
1. Modeling on Demand
The core philosophy of the AI Diagram Generator is “Modeling on Demand.” Instead of focusing on the mechanics of drawing—sizing boxes, aligning arrows, and adjusting fonts—the user focuses purely on intent. By acting as an intelligent assistant, the AI translates a conceptual request (e.g., “Hospital Management System”) into a structured visual representation, strictly adhering to industry standards.
2. The “Blank Canvas” Solution
The primary problem this tool solves is the initial setup fatigue. Traditionally, creating a Class or Sequence diagram required significant manual effort just to establish the baseline structure. The AI Diagram Generator eliminates this by instantly populating the canvas with a logically laid-out diagram, allowing the architect to immediately switch to the refinement and analysis phase.
3. Supported Diagram Types
Visual Paradigm has expanded the capabilities of the generator to cover a wide array of diagrammatic needs, ranging from structural UML diagrams to data analysis charts.
| Category | Diagram Types | Primary Use Case |
|---|---|---|
| Structural UML | Class, Object, Component | Defining system architecture and static relationships. |
| Behavioral UML | Use Case, Sequence, State Machine | Modeling system interactions, user journeys, and object states. |
| Project Management | PERT Charts | Visualizing project timelines and task dependencies. |
| Data Analysis | Radar Charts (Spider Charts) | Multi-dimensional data comparison and performance profiling. |
Guidelines for Using the AI Diagram Generator
To maximize the efficacy of the AI Diagram Generator, users must follow a structured approach. Note that this feature requires the Desktop Professional Edition (or higher) with an active maintenance plan.
Step 1: Accessing the Tool
The integration of the AI tool is designed to be intuitive. Launch Visual Paradigm and navigate to the main menu. Select Tools and then click on AI Diagram. This will open the generation interface.
Step 2: Selecting the Diagram Type
In the dialog box that appears, you must select the specific type of diagram you wish to generate. This is a critical step, as the AI needs to know the syntactical rules it must follow (e.g., distinguishing between a Sequence Diagram’s timeline and a Class Diagram’s hierarchy).
Step 3: Prompt Engineering
In the prompt field, clear communication is key. Enter the topic or system name concisely. For example:
- For Systems: Enter “Online Retail System” or “Library Management System.”
- For Comparisons: Enter specific variables if generating a Radar Chart (e.g., “Product A vs Product B across 5 performance metrics”).
Step 4: Generation and Refinement
Click OK to initiate the process. The AI will process the request and generate a diagram with a clean, automatic layout. Once generated, the diagram is not a static image; it is fully editable. You can—and should—refine the result using the standard Visual Paradigm editor tools to tailor the specifics to your project’s unique requirements.
Tips and Tricks for Optimal Results
While the tool is designed for ease of use, employing specific strategies can significantly enhance the quality of the output and speed up your workflow.
Leverage the Radar Chart for Data Analysis
The recent addition of Radar Chart support (December 2025) changes how analysts can visualize multi-dimensional data. Instead of manually calculating proportional scales for axes:
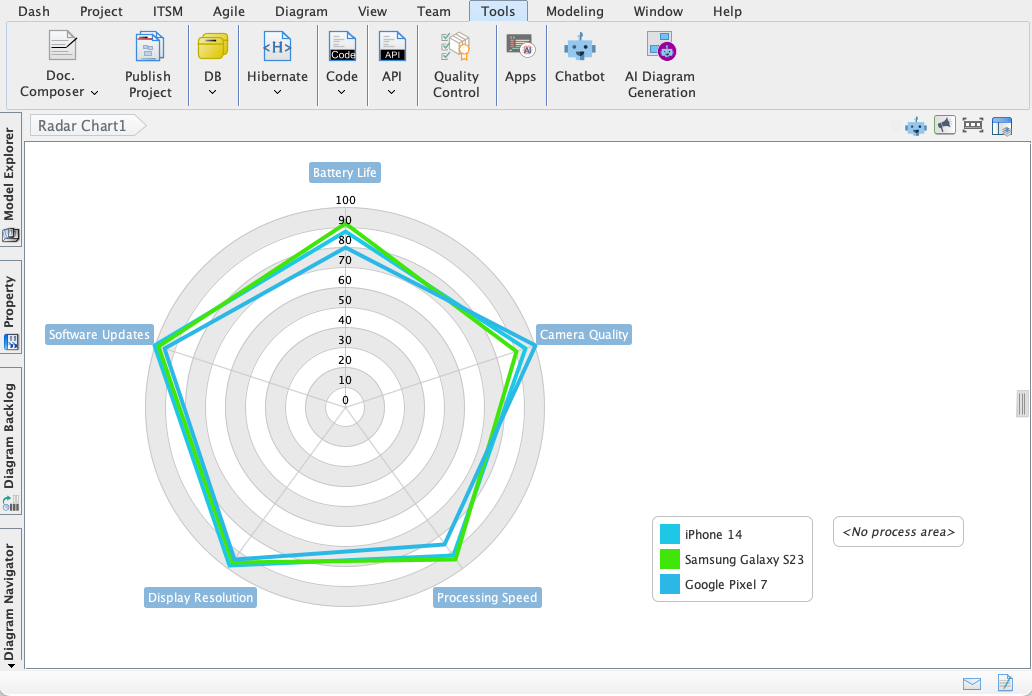
- Quick Comparisons: Use the prompt to request overlays, such as “Actual vs. Target Performance.” This allows the AI to generate a chart that instantly highlights performance gaps.
- Profile Mapping: Use this for HR or Product Management to map out “Skills Assessments” or “Feature Comparisons” without wrestling with spreadsheet graphs.
Be Specific with System Names
When generating UML diagrams, ambiguity leads to generic results. Instead of typing “Login System,” try “Biometric Security Login System.” The added context helps the AI infer necessary classes or states (like “Fingerprint Scanner” or “Face ID Verification”) that a generic prompt might miss.
Iterative Prototyping
Do not expect the AI to generate the final deliverable in one shot. Use the tool for rapid prototyping. Generate a “Use Case Diagram” to get the actors and primary cases on the board, and then manually add the unique, edge-case constraints that only you know. This hybrid approach—AI for structure, Human for nuance—yields the best efficiency.
Integration with Reporting
Because the AI generates clean layouts automatically, these diagrams are ready for immediate export into reports. This is particularly useful for PERT charts in project management, where visual clarity of the critical path is required for stakeholder presentations.
Conclusion
The Visual Paradigm AI Diagram Generator represents a massive leap forward in modeling efficiency. By automating the tedious “drag-and-drop” phase of system design, it liberates professionals to focus on architectural decision-making and data interpretation. Whether you are generating complex Sequence Diagrams or insightful Radar Charts, integrating this tool into your daily workflow will significantly reduce time-to-delivery and enhance documentation quality.
-
AI-Powered Visual Modeling and Design Solutions by Visual Paradigm: Explore cutting-edge AI-driven tools for visual modeling, diagramming, and software design, enabling faster, smarter development workflows.
-
AI Chatbot Feature – Intelligent Assistance for Visual Paradigm Users: Leverage AI-powered chatbot functionality to get instant guidance, automate tasks, and enhance productivity within Visual Paradigm.
-
Visual Paradigm Chat – AI-Powered Interactive Design Assistant: An interactive AI chat interface that helps users generate diagrams, write code, and solve design challenges in real time.
-
AI Textual Analysis – Transform Text into Visual Models Automatically: Use AI to analyze text documents and automatically generate diagrams such as UML, BPMN, and ERD for faster modeling and documentation.
-
Visual Paradigm AI Chatbot Enhances Multi-Language Support …: 7 hours ago · Discover the latest updates to Visual Paradigm ‘s AI -Powered visual modeling software, including multi-language UI and improved chat content localization. Experience seamless AI diagram generation in languages like Spanish, French, Chinese, and more with our AI chatbot for UML and other diagrams.
-
AI Chatbot for Diagramming: How It Works with Visual Paradigm: The Visual Paradigm AI chatbot is an AI -powered modeling assistant that turns natural language into diagrams. It doesn’t require users to learn specific modeling standards or syntax.
-
AI-Powered Use Case Diagram Refinement Tool – Smart Diagram Enhancement: Leverage AI to automatically refine and optimize your use case diagrams for clarity, consistency, and completeness.
-
Convert Use Case to Activity Diagram – AI-Powered Transformation: Automatically convert use case diagrams into detailed activity diagrams using AI to visualize system workflows.
-
AI-Assisted UML Class Diagram Generator – Visual Paradigm: An interactive, step-by-step tool to help users create UML class diagrams with AI-powered suggestions, validation, PlantUML export, and design analysis.
-
Mastering UML Activity Diagrams with AI | Visual Paradigm Blog: A blog post exploring how AI-powered features in Visual Paradigm enhance the creation and optimization of UML activity diagrams for developers and analysts.
-
Visual Paradigm AI Diagram Generation Guide: A comprehensive step-by-step guide to using Visual Paradigm’s AI-powered tools for generating diagrams quickly and accurately.
-
AI Diagram Generation Features in Visual Paradigm: Explore the advanced AI capabilities in Visual Paradigm that enable users to generate diagrams from natural language descriptions.
-
Visual Paradigm AI Diagram Generator Release Notes: Official release notes detailing the latest updates and enhancements to the AI Diagram Generator in Visual Paradigm.
-
Visual Paradigm’s AI Diagram Generator Expands Instant Creation Capabilities: Coverage of how Visual Paradigm’s AI diagram generator now supports instant creation of DFDs, ERDs, mind maps, and more.
-
New Diagram Types Added to AI Diagram Generator: DFD & ERD: Announcement of expanded AI diagram generation support for Data Flow Diagrams (DFD) and Entity Relationship Diagrams (ERD).
-
AI Diagram Generator Now Supports Package Diagrams in Visual Paradigm: New release enabling AI-generated package diagrams for better software architecture visualization.
-
AI Diagram Generator Adds Radar Chart Support: Visual Paradigm introduces AI-powered radar chart generation for visualizing complex performance and capability metrics.
-
Comprehensive Tutorial: Generating ArchiMate Diagrams with AI: In-depth tutorial showing how to use Visual Paradigm’s AI diagram generator to create ArchiMate diagrams and viewpoints efficiently.
-
From Problem Description to Class Diagram: AI-Powered Textual Analysis: Explore how Visual Paradigm uses AI to convert natural language problem descriptions into accurate class diagrams for software modeling.
-
How to Translate Text in Images for UML, BPMN, and Flowcharts: Step-by-step guide on using AI-powered tools to extract and translate text in technical diagrams for global collaboration and localization.