


Introduction to Automated Requirement Visualization
In the fast-paced world of software development, bridging the gap between technical requirements and visual representation is often a bottleneck. Traditionally, business analysts and developers spend hours manually drawing diagrams to represent system behaviors. However, the integration of Artificial Intelligence into documentation workflows has revolutionized this process. By transforming textual use cases into visual diagrams instantly, teams can save time, improve clarity, and reduce logical errors.
This guide outlines the process of automating UML activity diagram generation from software requirements, leveraging AI tools to streamline your workflow.
Key Concepts
Before diving into the workflow, it is essential to understand the foundational elements involved in this automation process.
- Use Case: A methodology used in system analysis to identify, clarify, and organize system requirements. It describes a sequence of actions that provide a measurable value to an actor.
- UML Activity Diagram: A behavioral diagram in the Unified Modeling Language (UML) that depicts the flow of control or data. It visually represents the series of actions defined in the use case.
- Actors: The entities that interact with the system. These can be human users (e.g., ‘Customer’) or other external systems (e.g., ‘Payment Gateway’).
Step-by-Step Guidelines
Follow these four standardized steps to convert raw text into professional reports and diagrams.
Step 1: Identify the Context
The first step in any robust documentation process is establishing the scope. Before describing how the system works, you must define who is involved and what is being achieved.
- Define the Use Case Name: Give it a clear, action-oriented title (e.g., “Process User Checkout”).
- Define the System: Specify the boundary of the application or module.
- Define the Actors: List all primary and secondary actors who will trigger or participate in the events.
Step 2: Describe the Flows
This is the core of the data input. You need to provide the narrative that the AI will interpret. Precision here ensures the accuracy of the resulting diagram.
- Main Flow: Detail the “Happy Path”—the ideal scenario where everything goes right. Write these as simple, line-by-line steps.
- Alternative Flows: Describe valid variations, such as a user choosing a different payment method.
- Error Conditions: Explicitly state what happens when things go wrong (e.g., “Login Failed” or “Server Timeout”).
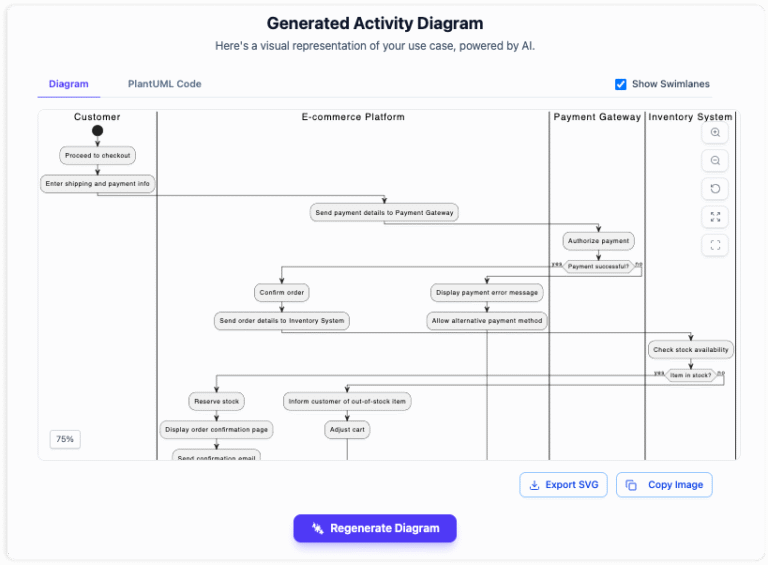
Step 3: Generate the Diagram
Once the textual data is structured, the AI tool processes the information to create a visual representation. This step automates the tedious task of dragging and dropping shapes.
The tool translates your steps into standardized Mermaid syntax, instantly rendering a UML Activity Diagram. This visual verifies the logic of your text, highlighting decision nodes and parallel processes automatically.
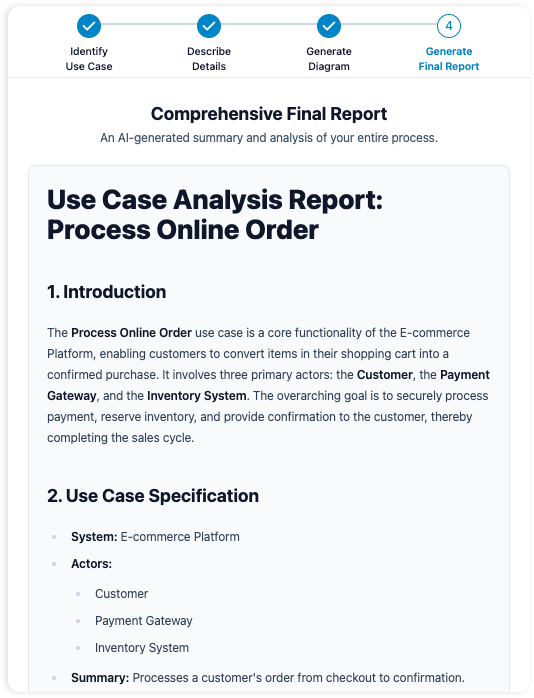
Step 4: Generate the Report
The final step is documentation consolidation. Rather than keeping diagrams and text separate, generate a comprehensive report. A well-structured report should include:
- The use case metadata (Name, System, Actors).
- The textual step-by-step description.
- The rendered UML Activity Diagram.
- A summary of logical flows.
Best Practices
To ensure high-quality output when using AI diagramming tools, adhere to these industry standards:
- Use Atomic Steps: Ensure each step in your description represents a single action. Do not combine multiple actions into one sentence.
- Standardized Naming: Keep actor names and system objects consistent throughout the text to prevent the AI from creating duplicate entities.
- Active Voice: Write in the active voice (e.g., “User clicks Submit”) rather than passive voice (e.g., “Submit is clicked by User”) to ensure the direction of the flow is clear.
- Explicit Logical Branches: clearly mark where a decision point occurs using keywords like “If,” “Else,” or “In case of.”
Common Mistakes
Even with advanced automation, human input determines the quality of the output. Avoid these frequent pitfalls:
| Mistake | Consequence | Correction |
|---|---|---|
| Vague Terminology | The diagram may lack specific decision nodes or action states. | Be specific. Instead of “User processes data,” say “User inputs date of birth.” |
| Ignoring Error Paths | The resulting diagram implies a system that never fails, leading to incomplete development. | Always include exception scenarios like “Invalid Password” or “Network Error.” |
| Overloading the Use Case | The diagram becomes spaghetti-like and unreadable. | Break complex processes into smaller, modular sub-use cases. |
Conclusion
Transitioning from manual drawing to AI-powered diagram generation offers immediate benefits in speed and efficiency. By standardizing how you identify and describe requirements, you can produce professional UML activity diagrams in minutes rather than hours. This not only streamlines the workflow for technical writers and developers but also improves clarity for stakeholders, ensuring that the software built matches the requirements defined.
-
AI Chatbot for Diagramming: How It Works with Visual Paradigm: The Visual Paradigm AI chatbot is an AI -powered modeling assistant that turns natural language into diagrams. It doesn’t require users to learn specific modeling standards or syntax.
-
AI-Powered Use Case Diagram Refinement Tool – Smart Diagram Enhancement: Leverage AI to automatically refine and optimize your use case diagrams for clarity, consistency, and completeness.
-
Convert Use Case to Activity Diagram – AI-Powered Transformation: Automatically convert use case diagrams into detailed activity diagrams using AI to visualize system workflows.
-
AI-Assisted UML Class Diagram Generator – Visual Paradigm: An interactive, step-by-step tool to help users create UML class diagrams with AI-powered suggestions, validation, PlantUML export, and design analysis.
-
Mastering UML Activity Diagrams with AI | Visual Paradigm Blog: A blog post exploring how AI-powered features in Visual Paradigm enhance the creation and optimization of UML activity diagrams for developers and analysts.
-
Visual Paradigm AI Diagram Generation Guide: A comprehensive step-by-step guide to using Visual Paradigm’s AI-powered tools for generating diagrams quickly and accurately.
-
AI Diagram Generation Features in Visual Paradigm: Explore the advanced AI capabilities in Visual Paradigm that enable users to generate diagrams from natural language descriptions.
-
Visual Paradigm AI Diagram Generator Release Notes: Official release notes detailing the latest updates and enhancements to the AI Diagram Generator in Visual Paradigm.
-
Visual Paradigm’s AI Diagram Generator Expands Instant Creation Capabilities: Coverage of how Visual Paradigm’s AI diagram generator now supports instant creation of DFDs, ERDs, mind maps, and more.
-
New Diagram Types Added to AI Diagram Generator: DFD & ERD: Announcement of expanded AI diagram generation support for Data Flow Diagrams (DFD) and Entity Relationship Diagrams (ERD).
-
AI Diagram Generator Now Supports Package Diagrams in Visual Paradigm: New release enabling AI-generated package diagrams for better software architecture visualization.
-
AI Diagram Generator Adds Radar Chart Support: Visual Paradigm introduces AI-powered radar chart generation for visualizing complex performance and capability metrics.
-
Comprehensive Tutorial: Generating ArchiMate Diagrams with AI: In-depth tutorial showing how to use Visual Paradigm’s AI diagram generator to create ArchiMate diagrams and viewpoints efficiently.