


UML Activity Diagrams are among the most versatile tools in the Unified Modeling Language (UML 2.x) toolkit. While Sequence Diagrams focus on object interactions and State Machine diagrams emphasize internal states, Activity Diagrams excel at visualizing how a process executes—from start to finish. They serve as the definitive blueprint for workflows, business processes, algorithms, and system logic, illustrating the sequence of actions, decision points, parallel activities, and data flows.
This guide provides a comprehensive breakdown of UML Activity Diagrams, using the “Process Order” system as a case study, while introducing the cutting-edge capabilities of the Visual Paradigm (VP) AI ecosystem to accelerate modeling and ensure accuracy.
1. The Grammar of the Diagram: Key Components & Notation
To model complex workflows effectively, one must master the specific symbols defined in UML 2.5. Visual Paradigm fully supports these standards, allowing for rigorous adherence to modeling conventions.

| Symbol | Visual Representation | Purpose |
|---|---|---|
| Initial Node | Solid black circle | The absolute starting point of the activity. |
| Activity / Action | Rounded rectangle | Represents an atomic step or task (e.g., “Receive Order”). |
| Object Node | Rectangle (optional keyword «object») |
Represents physical items or data entities produced/consumed (e.g., “Invoice”). |
| Decision Node | Diamond | Points where flow branches based on a condition. |
| Guard Condition | Text in [brackets] on edges |
Defines the logic for a path (e.g., vanity [order accepted]). |
| Fork Node | Vertical black bar (split) | Splits the flow into concurrent, parallel paths. |
| Join Node | Vertical black bar (merge) | Synchronizes parallel paths; waits for all branches to complete. |
| Activity Final Node | Bullseye circle | Marks the end of the entire process. |
| Flow Final Node | Circle with “X” inside | Marks the end of a single path while others continue. |
| Partitions (Swimlanes) | Vertical or horizontal lines | Groups actions by actor, role, department, or system logic. |
| Pins | Small squares on actions | Mark the entry/exit points of data for object flows. |
| Expansion Region | Dashed rectangle with keyword | Indicates a repeating or iterative subprocess. |
| Exception Handler | Zigzag edge to handler action | Interrupts the flow when a specific error condition occurs. |
Note on Flow Types:
Control Flow: Solid arrow (represents the sequence of operations).
Object Flow: Dashed arrow (represents the movement of data between nodes).
2. Case Study: The “Process Order” Workflow
A textbook example of a complex Activity Diagram is a standard Order Processing System. Below is a walkthrough of how this diagram structures logic, control flow, and data movement. This serves as the basis for understanding both the diagram mechanics and its AI generation.
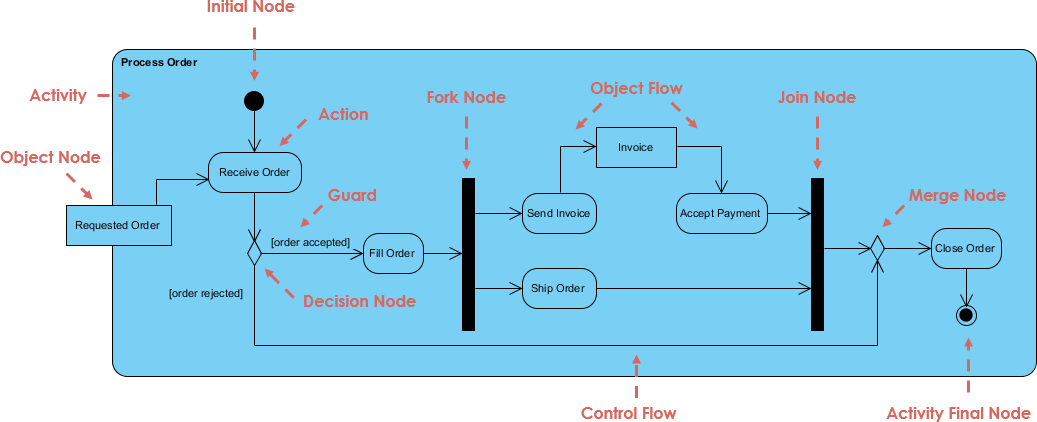
Phase 1: Initiation and Validation
-
Start: Begins at the Initial Node.
-
Action: The system performs Receive Order, creating a
Requested Orderobject. -
Decision: A diamond-shaped node checks if the order is valid.
-
Branch A (Rejection): If
[order rejected], flow goes directly to a synchronization point, skipping fulfillment. -
Branch B (Validation): If
[order accepted], the flow proceeds to Fill Order, consuming the object.
-
Phase 2: Parallel Processing (Concurrency)
Once the order is filled, the workflow utilizes a Fork Node to split operations into two independent tracks:
-
Path A (Billing): Execute Send Invoice (producing an
Invoiceobject) $\rightarrow$ Accept Payment. -
Path B (Logistics): Execute Ship Order.
Phase 3: Synchronization and Completion
Concurrency is resolved through the Join Node, which synchronously waits for both the “Payment Acceptance” and “Shipping” to complete before proceeding.
-
Merge: The successful synchronization path merges with the earlier rejected path at a Merge Node.
-
Termination: Both paths converge at the Close Order action, leading finally to the Activity Final Node.
Key Takeaway: This design elegantly demonstrates concurrency (Billing and Shipping happen independently) and object flow (the Invoice is generated as a resource that can be consumed later).
3. Best Practices & Common Pitfalls
Creating high-quality diagrams requires discipline. Whether modeling manually or using AI assistance, adhere to these principles:
-
Level of Abstraction: Keep one level of abstraction per diagram. Use hierarchical sub-activities if you need to show excessive detail.
-
Action Naming: Always use verb-noun phrasing (e.g., “Cancel Payment” vs. “Payment”).
-
Fork vs. Decision: Use Fork/Join only for true parallelism. Never use them for alternatives; always pair Decision/Merge for conditional branching.
-
Rule of Thumb: Every Fork must have a matching Join downstream, and every Decision has a corresponding Merge.
-
-
Swimlanes: Include vertical or horizontal partitions early if multiple actors (e.g., Admin, Customer, Logistics) interact.
-
Loop Validation: Ensure iterative loops connect clearly back to Decision Nodes or specific points using back-edges.
-
Common Pitfalls:
-
Overloading: One large diagram often obscures complexity; break it into smaller sections.
-
Missing Synchronization: Forgetting the Join Node at the end of a Fork Node (allowing paths to run indefinitely without blocking) is a common logic error.
-
Data Integrity: Ignoring object pins leads to diagrams that miss crucial data transfers between processes.
-
4. Accelerating Creation: The Visual Paradigm AI Ecosystem
Traditionally, drawing UML diagrams from scratch can be time-consuming and error-prone. The Visual Paradigm (VP) AI ecosystem (including VP Desktop, the AI Visual Modeling Chatbot, and Online tools like OpenDocs) transforms the creation of Activity Diagrams. It allows users to convert natural language descriptions into production-ready, UML 2.5-compliant models in seconds.
The VP ecosystem offers three distinct pathways for creation:
Option A: AI Visual Modeling Chatbot (Text-to-Diagram)
Best for: Rapid prototyping and full diagram generation.
-
Navigate to chat.visual-paradigm.com (or open the chat in VP Desktop).
-
Input a detailed scenario: “Create a UML Activity Diagram for a Process Order system. Start with Receive Order. If [order rejected], skip to completion. If [order accepted], Fill Order, then Fork into Billing (Send Invoice, Accept Payment) and Logistics (Ship Order). Join both paths, Merge with the rejected flow, and Close Order.”
-
The AI instantly renders the diagram with correct Fork/Join pairs, Guard conditions, and Object nodes.
-
Refine Conversationally: “Add vertical swimlanes for Billing and Logistics” or “Change the rejected path to use a Flow Final Node.”
Option B: Use Case to Activity Diagram Generator (Requirements-Driven)
Best for: Professional workflows starting from text-based requirements.
-
Log into Visual Paradigm Online → Click Create with AI.
-
Select the Use Case to Activity Diagram App.
-
Provide the System Name, Use Case details, Main Flow steps, and Error conditions.
-
AI generates the optimized diagram and a supporting report automatically.
Option C: VP Desktop (Professional Polish)
Best for: Final review, linking, and export.
-
Generate the base model via AI.
-
Use the desktop editor for drag-and-drop adjustments, adding partitions, or linking to other diagrams (e.g., linking an Activity to a Class diagram).
-
Export to PDF, Word, or Confluence via OpenDocs.
💡 Prompt Engineering Tips for VP AI
To get the highest fidelity output, be explicit in your prompts:
-
Explicit Structure: “Include Fork and Join for the parallel billing and shipping steps.”
-
Data Scope: “Show the Invoice object node with outgoing object flow to the Accept Payment node.”
-
Conditional Logic: “Use
[order accepted]and[order rejected]as guard conditions.” -
Layout Control: “Auto-layout with vertical swimlanes for departments.”
5. Experience Sharing & Real-World Impact
Based on usage patterns and user feedback from 2026, the integration of AI into UML modeling has shifted industry standards:
-
Time Savings: What previously took 30–60 minutes of manual modeling and debugging can now be achieved in under 60 seconds by the AI.
-
Accuracy & Standards Compliance: AI ensures that critical structural elements—such as pairing Forks with Joins or placing Decision diamonds correctly—are never overlooked, making diagrams ready for enterprise-level reviews.
-
Iteration is Magical: Teams report replacing whiteboard sessions with conversational refinement. Starting with a vague manual like “e-commerce order process,” a user can instantly ask: “Add an exception handler if payment fails,” instantly updating the model.
-
Real-World Wins:
-
Business Analysts converting textual requirements into traceable models.
-
Software teams linking Activity Diagrams directly to code generation scripts.
-
Collaborative documentation within Confluence/Notion via OpenDocs.
-
Limitations & Workarounds
While powerful, AI excels at structure generation. Very deeply nested loops may occasionally require minor manual nuances. However, the “Pro Tip” from heavy users is to treat the AI output as a draft: Generate in the chat/app, refine the layout in Desktop, and use auto-layout to ensure clarity.
6. Next Steps & Resources
The future of UML modeling lies in combining human expertise with AI precision. The “blank canvas” problem is solved, allowing focus to shift from drawing to logic.
-
Try it Free: Access the Visual Paradigm AI tools provided by the vendor.
-
Practice: Take the “Process Order” description above and paste it into the AI chatbot to see the diagram materialize instantly.
-
Export & Integrate: Use OpenDocs to export your models to PDF, Word, or embed them directly into your team wikis.
Whether you are documenting business processes, designing software workflows, or teaching UML, Activity Diagrams powered by the Visual Paradigm AI ecosystem deliver professional-grade results with unprecedented speed.
-
Mastering UML Activity Diagrams with AI | Visual Paradigm Blog: This article explores how AI-powered features enhance the creation and optimization of UML activity diagrams for developers and analysts.
-
Integrating AI Activity Diagrams into Your Visual Paradigm Workflow: A technical guide explaining how to use AI modeling software to generate and refine activity diagrams using natural language.
-
Generate Activity Diagrams from Use Cases Instantly with AI: This resource highlights how an AI engine enables the rapid conversion of use case descriptions into professional activity diagrams.
-
Convert Use Case to Activity Diagram – AI-Powered Transformation: This page details a tool that automatically converts use case diagrams into detailed activity diagrams to visualize system workflows.
-
AI-Powered Use Case to Activity Diagram Tutorial: A step-by-step guide demonstrating how AI features can automatically transform use case descriptions into detailed activity diagrams.
-
Convert Use Case Diagrams to Activity Diagrams with Visual Paradigm: This resource explains the process of using intelligent modeling features to transform use case diagrams into activity diagrams automatically.
-
Interactive UML Activity Diagram Creator – AI Chat Interface: An interactive tool that allows users to generate and edit UML activity diagrams in real time through an AI-powered chat interface.
-
Comprehensive Guide: Transforming Use Cases into UML Activity Diagrams with AI: A detailed walkthrough on using AI-powered tools to automate the transition from use cases to structured activity diagrams.
-
AI-Powered Editor for Converting Use Cases to Activity Diagrams: This online editor uses AI to provide intelligent suggestions while transforming use cases into structured UML activity diagrams.
-
Interaction Overview vs. Interaction vs. Activity Diagram in UML: A comparative guide that explains the differences and specific use cases for activity diagrams compared to other UML interaction models.