


As software ecosystems expand into distributed architectures and microservices, the traditional methods of planning are facing significant stress. User Story Mapping remains a foundational practice for Agile teams, but its application within enterprise environments requires a fundamental shift. We are moving from a linear sequence of tasks to a dynamic visualization of value across complex systems.
This guide explores how to adapt User Story Mapping for scale without losing the human element that makes it effective. We examine the intersection of product strategy, architectural constraints, and team collaboration in a global context.
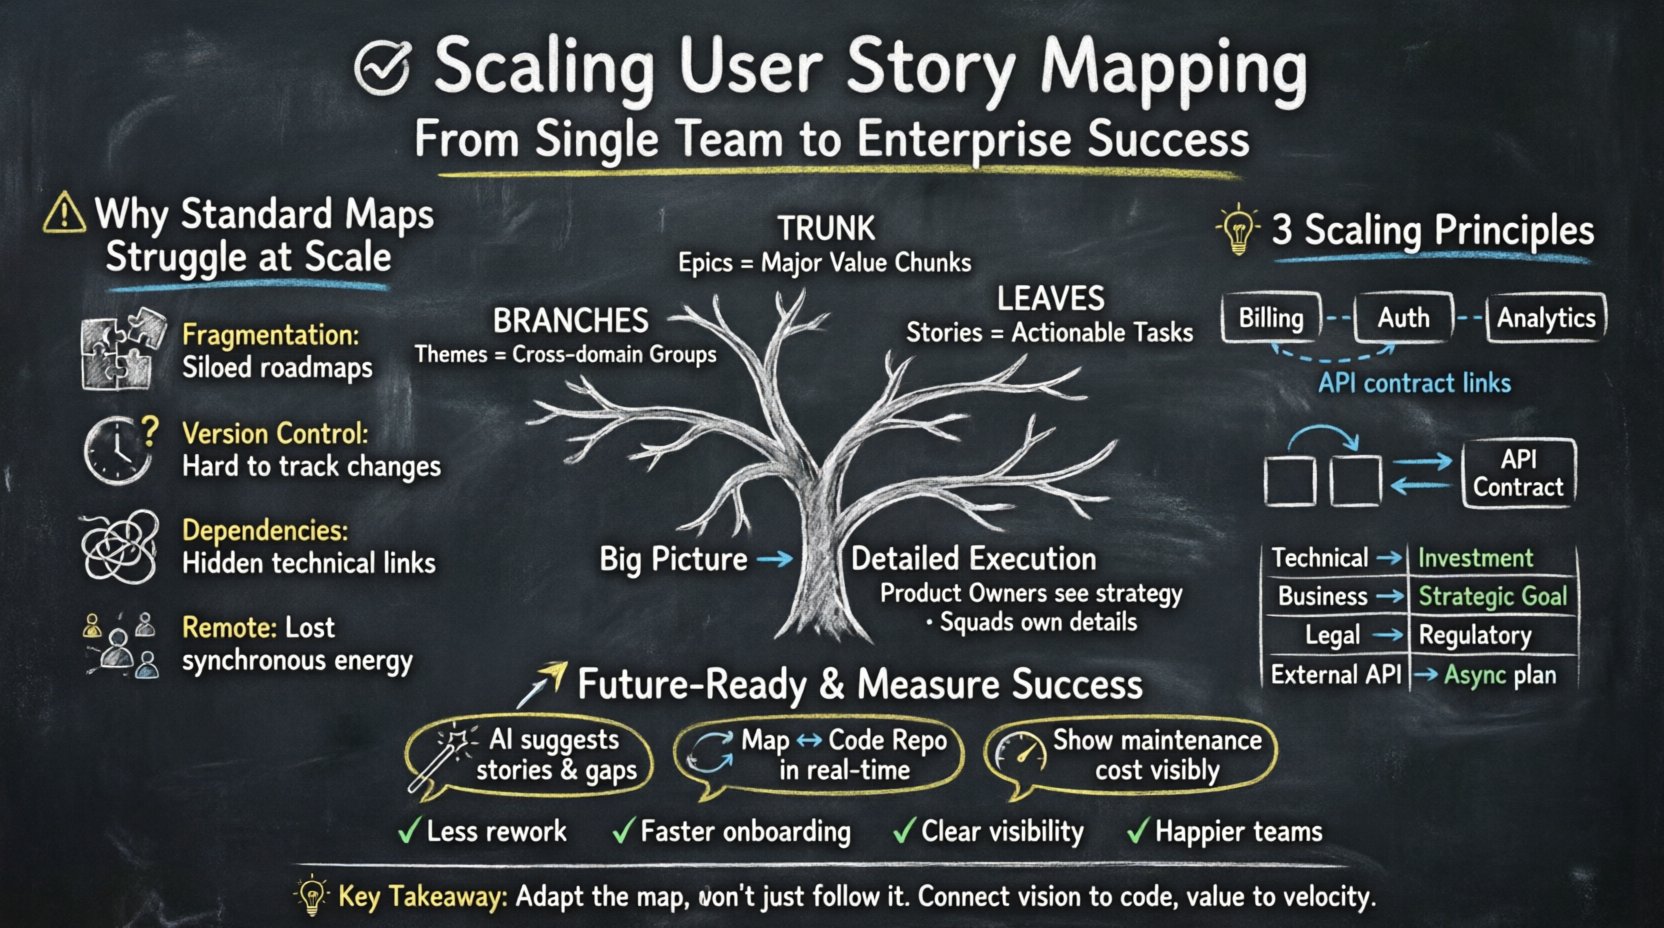
Why Standard Mapping Struggles at Scale 📉
On a single team of five to eight members, a physical whiteboard or a simple digital canvas works well. Everyone can see the whole picture. However, when you scale to hundreds of developers across multiple squads, a single map becomes unwieldy. The cognitive load of maintaining a unified view increases exponentially.
Several specific challenges emerge when applying this technique to large systems:
- Fragmentation: Different squads often work on disjointed parts of the user journey, leading to siloed roadmaps.
- Version Control: Keeping track of changes to the map over time becomes difficult without robust versioning strategies.
- Dependency Management: Large systems have deep technical dependencies that a simple “walking skeleton” map often fails to visualize.
- Remote Collaboration: Distributed teams struggle to maintain the synchronous energy of a physical planning session.
Addressing these issues requires a shift from viewing the map as a static artifact to treating it as a living system of interconnected data.
Principles for Scaling the Map 🏗️
To manage complexity, we must introduce hierarchy. A monolithic map is no longer feasible. Instead, we adopt a modular approach where high-level maps guide lower-level detailed maps.
1. Hierarchical Decomposition
Think of the mapping structure as a tree. The trunk represents the main value proposition. The branches represent major features or domains. The leaves are individual user stories.
- Epics: These form the backbone of the map, representing significant chunks of value.
- Themes: These group related stories that might span across different technical domains.
- Stories: The atomic units of work, detailed enough to be actionable.
This hierarchy allows Product Owners to maintain the “Big Picture” while Squad Leads manage the detailed implementation without constant interruption.
2. Domain-Driven Contexts
In large systems, context is key. Each domain (e.g., Billing, Authentication, Analytics) should have its own focused map. These maps link together through shared interfaces and API contracts.
When a story in the Billing domain impacts the Authentication domain, the connection is explicit. This prevents the “dependency hell” that often plagues large projects.
Alignment with Technical Architecture 🧩
One of the biggest gaps in traditional mapping is the disconnect between user value and system capability. In large-scale systems, technical debt and architectural constraints often dictate what can be built, not just what the user wants.
Integrating Architecture Decision Records
Every significant user story should ideally link to an Architecture Decision Record (ADR). This ensures that the decision to build a feature is backed by an understanding of the infrastructure.
- Frontend vs. Backend: Maps should clearly distinguish between client-side logic and server-side processing.
- Data Flow: Visualizing how data moves through the system helps identify bottlenecks early.
- API Contracts: User stories should reference the API version or contract they depend on.
The Table of Dependencies
| Dependency Type | Impact on Map | Mitigation Strategy |
|---|---|---|
| Technical | Blocks feature delivery | Include in “Investment” column |
| Business | Changes priority | Mark as “Strategic Goal” |
| Legal/Compliance | Mandatory inclusion | Tag as “Regulatory” |
| External API | External latency | Plan for async integration |
By categorizing dependencies, teams can prioritize work that unblocks others, rather than just working on the most “fun” features.
Collaboration in a Remote Environment 🌍
Physical whiteboards are no longer an option for many organizations. Digital collaboration tools must replicate the tactile experience of placing sticky notes.
Asynchronous Planning
When teams are in different time zones, synchronous workshops are impossible. Asynchronous mapping allows contributors to add stories and refine narratives on their own schedule.
- Time-Boxed Contributions: Set specific windows for feedback to avoid endless threads.
- Comment Threads: Attach discussions directly to specific stories to maintain context.
- Status Indicators: Use clear visual cues for “Draft”, “Review”, and “Approved” states.
The Role of Facilitators
In large-scale mapping, the facilitator’s role shifts from moving cards to curating information. They ensure that the map remains readable and that the hierarchy is respected.
- Prevent the map from becoming a dumping ground for ideas.
- Ensure that every story connects back to a user goal.
- Manage the flow of information between squads.
Data-Driven Mapping 📊
As systems grow, intuition is not enough. Data must inform the placement of stories on the map. We are moving toward maps that are generated or influenced by real user behavior.
Metrics as Story Context
Instead of guessing which story provides value, teams should attach success metrics to each story. This turns the map into a dashboard of potential value.
- Engagement: How many users interact with this feature?
- Conversion: Does this story drive a specific action?
- Retention: Does this feature keep users coming back?
Feedback Loops
The map should not be static. It should update based on post-release data. If a story performs poorly, it should be moved to the “Backlog” or “Archive” section immediately.
Future Trends in User Story Mapping 🚀
The practice is evolving. Several trends are shaping the future of how we visualize software development in complex environments.
1. AI-Assisted Refinement
Artificial Intelligence is beginning to assist in breaking down epics into stories. While it cannot replace human judgment, it can suggest standard patterns for user interactions based on historical data.
- Suggestion Engines: Proposing standard acceptance criteria.
- Prediction: Estimating effort based on similar past stories.
- Gap Analysis: Identifying missing steps in a user journey.
2. Real-Time Synchronization
Future maps will likely be live-connected to the code repository. As a developer commits code, the map updates. This creates a single source of truth where the plan and the reality are always in sync.
3. Visualizing Technical Debt
Currently, technical debt is often hidden. Future maps will explicitly show the cost of maintenance alongside new features. This forces stakeholders to balance innovation with stability.
Implementation Strategy for Enterprise 🏢
Transitioning to scaled mapping does not happen overnight. It requires a phased approach.
Phase 1: Standardization
Define a common vocabulary. Ensure that terms like “User Story”, “Epic”, and “Sprint” mean the same thing across all squads. This reduces friction when integrating maps.
Phase 2: Tooling Integration
Connect your mapping process with your issue tracking and CI/CD pipelines. Automation should handle the movement of data, not manual copying.
Phase 3: Cultural Adoption
The map is a tool for communication, not just planning. Train teams on how to use the map to solve problems, not just to assign tickets.
- Training Workshops: Regular sessions to refine mapping skills.
- Feedback Channels: Allow teams to suggest improvements to the process.
- Leadership Buy-in: Executives must value the map as a strategic document.
Measuring Success 📏
How do you know if scaled mapping is working? Look for these indicators:
- Reduced Rework: Fewer changes requested after development starts.
- Faster Onboarding: New team members understand the system faster.
- Better Visibility: Stakeholders can see progress without asking for status reports.
- Improved Morale: Teams feel they are building something coherent, not just fixing bugs.
Key Components of a Scaled Map 🧱
To ensure clarity in a large system, every map must contain specific elements.
| Component | Purpose | Frequency |
|---|---|---|
| Backbone | Defines the user journey | Quarterly |
| Activities | Breaks down the journey | Monthly |
| Tasks | Specific implementation steps | Weekly |
| Dependencies | Links between stories | Real-time |
By maintaining these components, the map remains relevant and actionable throughout the lifecycle of the software.
Final Thoughts on Adaptability 💡
The landscape of software development is constantly changing. What works today may not work tomorrow. The key to success in large-scale systems is not rigid adherence to a process, but the ability to adapt that process to the specific needs of the organization.
User Story Mapping provides a powerful framework for organizing chaos. When applied with the right principles of hierarchy, alignment, and data integration, it transforms into a strategic asset. It connects the vision of the product with the reality of the code, ensuring that every line of software serves a purpose.
As we look forward, the integration of technology and human insight will only deepen. Teams that embrace these changes will find themselves better equipped to deliver value in an increasingly complex digital world.