


Building a visual representation of your system architecture can feel like a daunting task. Many developers hesitate to start because they fear making mistakes or creating something too complex. This guide is designed to help you navigate the process of creating a class diagram with clarity and confidence. We will break down the essential components, relationships, and best practices so you can model your object-oriented systems effectively. 🛠️
What is a Class Diagram? 🧩
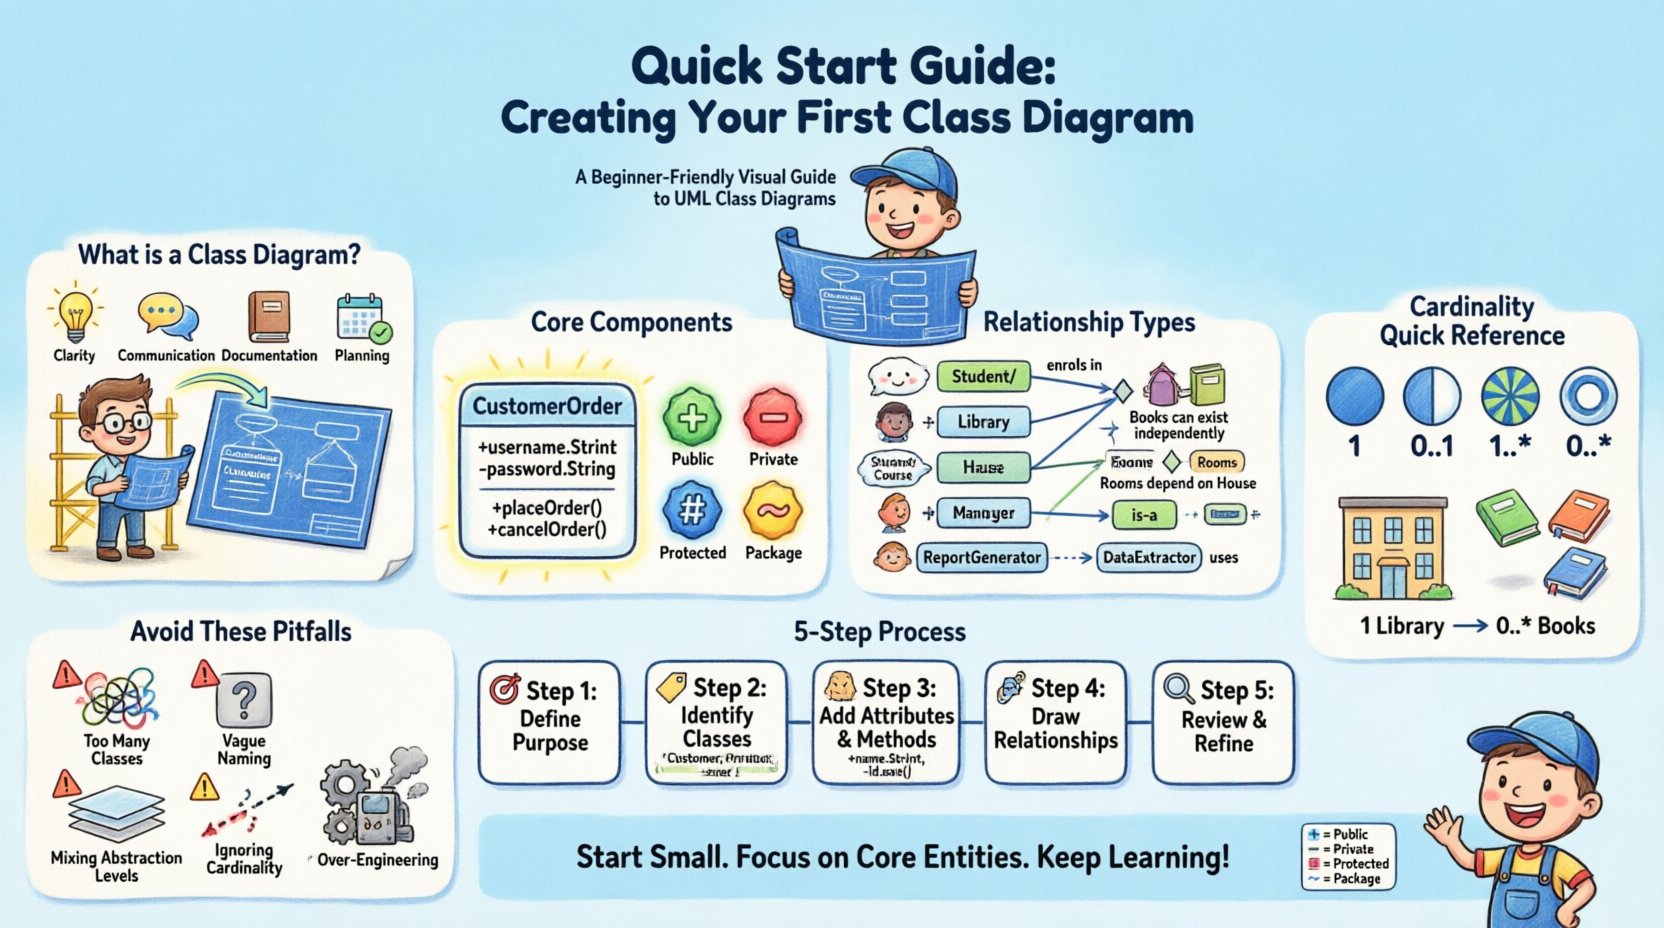
A class diagram is a type of static structure diagram in Unified Modeling Language (UML). It describes the structure of a system by showing the system’s classes, their attributes, operations (methods), and the relationships among objects. Think of it as a blueprint for your software. Just as an architect uses blueprints to understand how a building’s rooms connect, a developer uses class diagrams to understand how different parts of a program interact.
Here is why this visual tool is critical for software development:
Clarity: It provides a clear view of the system’s structure.
Communication: It helps stakeholders understand the design without reading code.
Documentation: It serves as permanent documentation for future maintenance.
Planning: It helps identify potential design issues before writing code.
When you are starting out, the goal is not perfection. The goal is to capture the essential structure of your domain. You can refine the diagram as your understanding deepens. 🌱
Core Components of a Class Diagram 🔨
Every class diagram is built from a few fundamental building blocks. Understanding these elements is the first step toward creating a meaningful diagram. We will explore the anatomy of a single class and how it fits into the larger picture.
1. The Class Box 📦
A class is represented by a rectangle divided into three compartments. Each compartment serves a specific purpose. The top compartment holds the class name, the middle holds attributes, and the bottom holds operations.
Class Name: This goes at the top. It should be a noun, written in PascalCase (e.g.,
CustomerOrderorPaymentProcessor).Attributes: These are the properties or data fields of the class. They describe the state of the object. For example, an
Userclass might have attributes likeusernameandemailAddress.Operations: These are the methods or functions the class can perform. They describe the behavior. For example, a
BankAccountclass might have an operation namedwithdrawFunds.
2. Visibility Modifiers 👁️
Not every attribute or operation needs to be accessible to every part of the system. You can indicate visibility using symbols before the name:
Public (+): Accessible from anywhere.
Private (-): Accessible only within the class itself.
Protected (#): Accessible within the class and its subclasses.
Package (~): Accessible within the same package or namespace.
For your first diagram, focus on the logical structure. You do not need to define every single visibility modifier immediately, but understanding the concept helps you think about encapsulation. 🔒
Understanding Relationships 🔗
Classes rarely exist in isolation. They interact with one another through relationships. Identifying these connections is the most important part of modeling a system. There are five primary types of relationships you need to know.
Relationship Types Overview 📋
Relationship | Symbol | Description | Example |
|---|---|---|---|
Association | Line | A structural relationship where objects are linked. | A |
Aggregation | Line + Hollow Diamond | A “has-a” relationship where parts can exist independently. | A |
Composition | Line + Filled Diamond | A strong “has-a” relationship where parts cannot exist independently. | A |
Inheritance (Generalization) | Line + Hollow Triangle | A “is-a” relationship where a subclass inherits from a superclass. | A |
Dependency | Dashed Line + Arrow | A usage relationship where one class relies on another. | A |
Diving Deeper into Associations
Association is the most common relationship. It simply means two classes are connected. You can add labels to the line to describe the nature of the connection. For example, a Teacher class might have an association labeled teaches with a Classroom class.
It is crucial to define the direction of the relationship. Is the connection one-way or two-way? A solid line with an arrowhead indicates a navigable direction. Without an arrow, the relationship is usually considered bidirectional.
Cardinality and Multiplicity 🔢
Relationships are not just binary connections; they have quantity. Cardinality tells you how many instances of one class relate to instances of another. This is often written as 1..1, 1..*, or 0..*.
1: Exactly one instance.
0..1: Zero or one instance (optional).
1..*: One or more instances.
0..*: Zero or more instances (optional, many).
Consider a Library and a Book. One library holds many books. One book is usually held by one library at a time. This would be represented as Library (1) ---- (0..*) Book.
Step-by-Step Guide to Creating Your Diagram 🚀
Now that you understand the vocabulary, let’s walk through the process of creating a diagram from scratch. Follow these steps to avoid getting lost in the details.
Step 1: Define the Purpose 🎯
Before drawing anything, ask yourself what you are modeling. Are you designing a new system? Documenting an existing one? Solving a specific problem? Knowing the scope prevents scope creep. If you try to model the entire enterprise in one diagram, it will become unreadable. Focus on a specific subsystem or feature.
Step 2: Identify the Classes 🏷️
Look at your requirements or problem statement. Identify the nouns. These nouns often translate directly into classes. For example, in an online store scenario, you might identify:
Customer
Product
Order
Payment
ShippingAddress
Do not worry about getting the exact list right immediately. It is normal to add or remove classes as you refine your understanding. Start with the high-level entities.
Step 3: Determine Attributes and Methods 🧠
For each identified class, list the essential data it holds and the actions it performs. Keep it simple. You do not need to list every single field.
Customer: Name, Email, Phone,
placeOrder(),updateProfile().Product: ID, Name, Price, Stock,
calculateDiscount().
If you find yourself listing too many attributes, you might be over-complicating the class. Consider if some data belongs to a different class.
Step 4: Draw the Relationships 🔗
Connect your classes using the relationship types discussed earlier. Ask questions to determine the type of connection:
Does one class own the other? (Composition/Aggregation)
Is one a type of the other? (Inheritance)
Does one simply use the other? (Association/Dependency)
Draw lines between the classes. Add labels if the relationship is ambiguous. Add cardinality indicators to specify how many objects are involved.
Step 5: Review and Refine 🔍
Look at your diagram as a whole. Does it make sense? Are there any circular dependencies? Is the naming consistent? A good diagram should be readable by a colleague without needing a detailed explanation.
Common Mistakes to Avoid ⚠️
Even experienced designers make errors when starting out. Being aware of these pitfalls will save you time and frustration.
Too Many Classes: Trying to put everything in one diagram creates a “spaghetti mess.” Break your model into subsystems or packages if it gets too large.
Vague Naming: Avoid generic names like
ObjectorData. Use specific nouns likeInvoiceorTransactionLog.Mixing Levels of Abstraction: Do not mix high-level business entities with low-level technical implementation details (like database tables) in the same view unless necessary.
Ignoring Cardinality: Forgetting to specify how many objects relate to each other can lead to logic errors in the code later.
Over-Engineering: Do not try to predict every future change. Model the requirements you have now. Flexibility in design is more important than rigid perfection.
Best Practices for Readability 📝
A diagram is a communication tool. If people cannot read it, it fails its purpose. Follow these tips to ensure your diagrams remain clear.
Consistent Layout: Arrange classes logically. Group related classes together. Avoid crossing lines where possible.
Standard Notation: Stick to standard UML conventions. This ensures anyone familiar with the standard can read your work.
Whitespace: Use space between classes. Cluttered diagrams are hard to scan.
Legend: If you use custom symbols or colors, provide a legend explaining their meaning.
Versioning: Treat your diagram like code. Keep track of versions so you know how the design has evolved.
When to Use a Class Diagram 🕒
Not every project needs a class diagram. Knowing when to use this tool is as important as knowing how to create one.
Useful Scenarios
Object-Oriented Design: Essential for projects heavily reliant on classes and objects.
Complex Logic: When the logic involves many interacting entities.
Team Collaboration: When multiple developers need to agree on the structure.
Legacy Refactoring: When documenting old code to understand its structure before modifying it.
When to Skip It
Simple Scripts: For small scripts with few functions, a diagram may be overkill.
Functional Programming: If your system is built on functions and data structures rather than classes, other diagrams may be more appropriate.
Rapid Prototyping: If you are moving very fast and expect frequent changes, whiteboarding or code-first approaches might be faster.
Refining Your Design Skills 🎨
Creating diagrams is a skill that improves with practice. You will find that your first attempts are rough. That is perfectly normal. The value lies in the act of thinking about the structure.
As you gain experience, you will notice patterns. You will start to recognize common structures like the Observer Pattern or the Factory Pattern in your diagrams. Recognizing these patterns helps you design more robust systems.
Remember that a class diagram is a snapshot in time. It represents the design at a specific moment. As requirements change, the diagram must evolve. This is not a failure of the diagram; it is a sign of a healthy, adaptable design process. 🔄
Final Thoughts on Modeling 🧭
Creating a class diagram is about organizing your thoughts. It forces you to confront the complexity of your system and define clear boundaries between components. By following the steps outlined here, you can produce a diagram that serves as a reliable guide for development.
Start small. Focus on the core entities. Draw the relationships. Review the structure. Repeat. With patience and practice, you will find that these diagrams become an invaluable part of your development toolkit. They reduce ambiguity and provide a shared language for your team. Keep learning, keep drawing, and keep building. 🚀