


When designing complex software systems, visualizing how different parts of a system interact over time is critical. While many developers are familiar with Sequence Diagrams or Use Case Diagrams, there is a specific tool that bridges the gap between high-level control flow and detailed object interaction: the Interaction Overview Diagram. This guide addresses the most common inquiries regarding this UML artifact, providing a deep dive into its structure, purpose, and application.
What Exactly Is an Interaction Overview Diagram? 📊
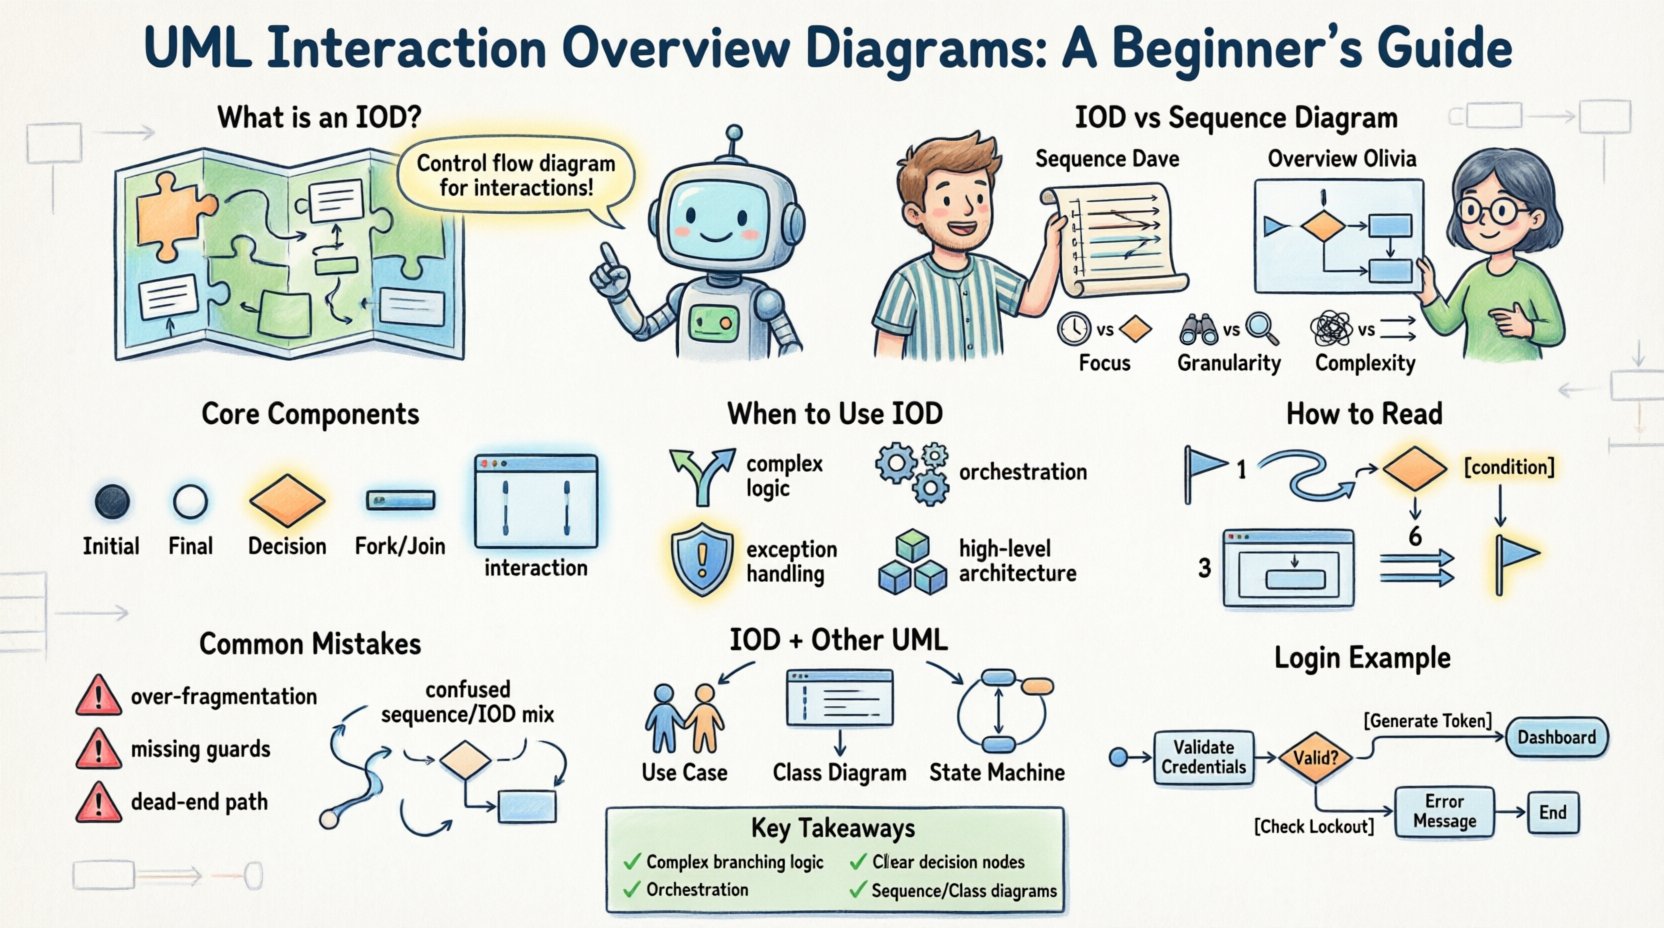
An Interaction Overview Diagram (IOD) is a type of activity diagram that serves as a control flow diagram for interactions. It is designed to show the overall flow of control and data between objects in a system, often incorporating elements from other UML diagrams like Sequence Diagrams. Think of it as a map that directs traffic between different interaction scenarios.
Unlike a standard Sequence Diagram, which focuses on the chronological order of messages between objects, an IOD focuses on the decision points and the flow between different interaction fragments. It allows you to model complex behaviors without cluttering a single sequence diagram with too many conditional branches.
- Primary Function: To manage the flow of control between different interaction fragments.
- Target Audience: System architects, software engineers, and technical analysts.
- Standard: Defined by the Object Management Group (OMG) as part of the Unified Modeling Language specification.
How Does It Differ From a Sequence Diagram? ⚖️
Understanding the distinction between these two diagrams is vital for effective modeling. While both deal with object interactions, their scope and granularity differ significantly.
| Feature | Sequence Diagram | Interaction Overview Diagram |
|---|---|---|
| Focus | Chronological order of messages between lifelines. | Control flow between interaction fragments. |
| Granularity | High detail on specific message exchanges. | High-level overview of interaction paths. |
| Decision Logic | Uses activation bars and guards within the flow. | Uses decision nodes and merge nodes explicitly. |
| Complexity | Can become cluttered with many conditions. | Keeps complexity manageable by fragmenting logic. |
| Analogy | A script of a conversation. | A flowchart of the conversation options. |
In practice, you might use an Interaction Overview Diagram when a Sequence Diagram becomes too wide or too deep. If a process has multiple branches based on user input or system state, an IOD allows you to encapsulate each branch into a separate interaction fragment, keeping the main diagram clean.
What Are the Core Components of an IOD? 🔧
To build a valid Interaction Overview Diagram, you must understand the standard notation used. The diagram is essentially a variation of an Activity Diagram, so it utilizes similar nodes and edges, but with a specific twist regarding how interactions are represented.
1. Control Flow Nodes
These nodes dictate the movement through the diagram. They are standard in activity modeling:
- Initial Node: A solid black circle representing the starting point of the interaction flow.
- Final Node: A circle with a thick border, indicating the successful end of the interaction sequence.
- Decision Node: A diamond shape used to split the flow based on a condition (e.g., “Is user logged in?”).
- Merge Node: Another diamond shape that combines multiple incoming flows back into a single path.
- Fork Node: A thick horizontal bar that splits one flow into multiple concurrent flows.
- Join Node: A thick horizontal bar that waits for all incoming concurrent flows before continuing.
2. Interaction Fragments
This is the defining feature of the IOD. Instead of drawing lifelines and messages directly on the main canvas, you encapsulate them into Interaction Frames.
- Structure: A rectangle with a label in the upper-left corner.
- Label: Typically reads “interaction” or “sequence”.
- Content: Inside the frame, you place the Sequence Diagram elements (lifelines, messages, activation bars).
This encapsulation allows you to treat a complex sequence as a single atomic action within the larger control flow. It is particularly useful when the same interaction pattern is reused in multiple places.
When Should You Use an Interaction Overview Diagram? 🎯
Not every project requires an Interaction Overview Diagram. Using it unnecessarily can add complexity where none is needed. Here are scenarios where an IOD adds significant value:
- Complex Business Logic: When a process involves multiple decision points and alternative paths that would make a sequence diagram unreadable.
- Orchestration: When coordinating multiple subsystems or services where the order of operations matters more than the internal message details of each service.
- Exception Handling: When you need to show how errors are caught and routed to different recovery processes.
- High-Level Architecture: When presenting the flow of data between major components to stakeholders who do not need to see every API call.
If your system is a simple linear request-response cycle, a Sequence Diagram is sufficient. If your system involves branching logic, loops, or parallel processing across different objects, an IOD becomes the better choice.
How to Read an Interaction Overview Diagram 🧐
Reading an IOD requires a shift in perspective. You are not reading a timeline; you are reading a logic map. Follow these steps to interpret the diagram effectively:
- Identify the Start: Locate the initial node (solid black circle). This is where the process begins.
- Trace the Control Flow: Follow the arrows. Arrows represent the flow of control, not necessarily time.
- Interpret Decision Nodes: At every diamond, look for the guard conditions (text in brackets, e.g., [user authenticated]). Follow the path that matches the condition.
- Enter Interaction Frames: When you encounter a frame, understand that it represents a sub-process. You do not need to analyze the internal messages unless you have the specific sequence diagram for that fragment.
- Handle Concurrency: If you see a fork node, recognize that multiple paths execute simultaneously. A join node will wait for all those paths to complete before proceeding.
- Locate the End: Trace until you reach the final node. Ensure all paths eventually lead to a termination point.
Common Mistakes Beginners Make 🚫
Even experienced modelers can stumble when creating Interaction Overview Diagrams. Avoid these common pitfalls to ensure your diagrams remain clear and useful.
- Over-fragmentation: Do not put every single message into its own interaction frame. If the interaction is simple, keep it inline. Only use frames for significant sub-processes.
- Missing Guard Conditions: At decision nodes, every outgoing edge should have a condition unless it is the only edge. If conditions are missing, the flow becomes ambiguous.
- Unreachable Paths: Ensure that every path leads to a final node. Dead ends in an IOD represent logic errors or incomplete design.
- Confusing Sequence and IOD: Do not try to draw a full sequence of messages inside the main IOD canvas if it should be encapsulated in a frame. Keep the IOD focused on flow.
- Lack of Consistency: Ensure that the interaction fragments referenced match the actual implementation or other diagrams. An IOD is useless if it contradicts the Sequence Diagrams.
How Does an IOD Integrate With Other UML Diagrams? 🔗
An Interaction Overview Diagram rarely exists in isolation. It is part of a larger modeling ecosystem. Here is how it connects with other artifacts:
1. Use Case Diagrams
Use Cases define the “what” of the system. An IOD can be used to elaborate on the “how” of a specific Use Case. If a Use Case has a complex post-condition or alternative flow, the IOD can detail the interaction steps required to satisfy that use case.
2. Class Diagrams
Class Diagrams define the structure. The IOD defines the behavior. The lifelines in an IOD correspond to instances of the classes defined in the Class Diagram. For example, if your Class Diagram has a “User” class, your IOD will have a lifeline labeled “User”.
3. State Machine Diagrams
>State Machine Diagrams focus on the state of a single object. An IOD focuses on the interaction between multiple objects. They complement each other. You might use a State Machine Diagram to define the internal state of a “PaymentProcessor” object, and then use an IOD to show how that object interacts with a “BankGateway” object during a transaction.
Best Practices for Designing Clear IODs 📝
Creating a diagram that is easy to understand requires discipline. Follow these guidelines to maintain high quality in your documentation.
- Use Consistent Naming: Lifelines should use the class name or a specific instance name (e.g., “customer:Customer”). Consistency helps readers map the diagram back to code.
- Limit Width: Interaction frames can become very wide. If a frame exceeds the page width, consider splitting the interaction into multiple frames or using a separate Sequence Diagram.
- Label Guard Conditions Clearly: Use Boolean expressions that are easy to read. Avoid complex logic inside the guard; if it is complex, move it to a separate model element.
- Group Related Flows: If you have multiple parallel paths, try to group them visually to show they belong to the same logical section.
- Document Assumptions: If an interaction relies on external data or services not modeled in the diagram, note this in the frame description or a legend.
Step-by-Step Guide to Creating an IOD 🛠️
Ready to create one? Follow this logical process to construct your diagram from scratch.
- Define the Scope: Determine the specific business scenario you are modeling. Is it a login process? A checkout flow? A data export?
- Identify the Actors: List all the objects or classes that participate in this interaction. These will become your lifelines.
- Map the High-Level Flow: Draw the control flow using Initial Node, Decision Nodes, and Final Node. Sketch the major branches (Success, Failure, Retry).
- Create Interaction Fragments: For each major step in the flow, decide if it requires a detailed Sequence Diagram. If so, create an Interaction Frame.
- Draw the Internal Sequence: Inside each frame, draw the lifelines and messages. Ensure the entry and exit points of the frame match the control flow arrows.
- Review for Completeness: Check that all decision nodes have guards. Check that all paths lead to a Final Node. Check that there are no orphaned fragments.
Real-World Example: A Login Process 🚪
To visualize this, consider a standard login system. A Sequence Diagram might show every message between the “LoginView”, “AuthService”, “Database”, and “User”. However, an IOD can show the logic around the login.
Scenario:
- User enters credentials.
- System validates credentials.
- If valid, redirect to dashboard.
- If invalid, show error.
- If account is locked, show lockout message.
IOD Structure:
- Initial Node: Starts the process.
- Interaction Frame 1: “Validate Credentials”. Inside, a Sequence Diagram showing the message flow to the database.
- Decision Node: “Credentials Valid?”.
- Path A (Yes): Goes to “Generate Token” frame, then “Redirect”.
- Path B (No): Goes to “Check Lockout” frame.
- Final Node: Process ends.
This structure allows a developer to see the logic of the login process without getting bogged down in the specific API calls used for validation, which might be detailed in a separate document.
What Are the Limitations of IODs? 🧱
While powerful, Interaction Overview Diagrams have constraints. Being aware of these limitations ensures you do not misuse the tool.
- No Timing Details: Unlike Sequence Diagrams, IODs do not show exact timing or message delays. They are logical, not temporal.
- Complexity Threshold: If the control flow itself becomes too complex, an IOD can become as messy as a Sequence Diagram. In such cases, a State Machine Diagram might be better.
- Tool Support: Not all modeling tools support Interaction Overview Diagrams with the same level of fidelity. Some may treat them merely as Activity Diagrams.
- Learning Curve: Team members need to understand UML notation. If the team is not familiar with IODs, they may confuse them with standard Activity Diagrams.
Summary of Key Takeaways ✅
Mastering the Interaction Overview Diagram requires understanding its role as a control flow manager for interactions. It sits between the high-level logic of Activity Diagrams and the detailed timing of Sequence Diagrams.
- Use it for: Complex branching logic, orchestration of services, and high-level interaction flows.
- Avoid it for: Simple linear flows or detailed timing analysis.
- Focus on: Decision nodes, interaction frames, and clear control flow paths.
- Combine with: Sequence Diagrams for detail, Class Diagrams for structure.
By integrating this diagram into your modeling toolkit, you gain a clearer view of how your system behaves under different conditions. It helps reduce ambiguity in requirements and provides a solid blueprint for implementation without getting lost in the minutiae of every single message exchange.