


Introduction
In today’s complex software development landscape, visual modeling isn’t just a “nice-to-have”—it’s a critical practice for building maintainable, scalable systems. After spending considerable time evaluating UML modeling tools and techniques, I’ve found that Component Diagrams and Deployment Diagrams stand out as two of the most practical diagrams for bridging the gap between abstract design and physical implementation.

This guide shares a third-party perspective on how these diagrams work, when to use them, and how tools like Visual Paradigm can streamline your architecture planning. Whether you’re a seasoned architect or a developer stepping into system design for the first time, understanding these diagrams can transform how you communicate, document, and execute your technical vision.
What is a Component Diagram?
From a practitioner’s standpoint, UML Component diagrams are invaluable for modeling the physical aspects of object-oriented systems. They help teams visualize, specify, and document component-based systems—and even support constructing executable systems through forward and reverse engineering. Essentially, component diagrams are class diagrams that zoom in on a system’s modular parts, focusing on the static implementation view.

Learn UML Faster, Better and Easier
For those seeking accessible tooling, Visual Paradigm Community Edition offers a free, award-winning UML modeler that supports all diagram types. Users report that its intuitive interface significantly reduces the learning curve for UML newcomers while still providing the depth experts need.
Component Diagram at a Glance
In practice, a well-constructed component diagram breaks down a system into high-level functional units. Each component owns a clear responsibility and interacts with others only through well-defined interfaces—a principle that aligns beautifully with modern microservices and modular architecture patterns.
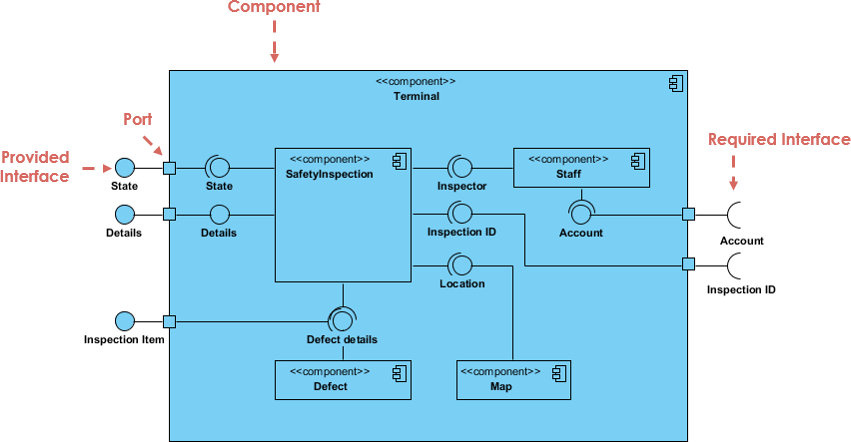
Key observations from real-world usage:
-
Data flows into components via ports (like the right-hand side in the example), where required interfaces (sockets) represent services the component needs to function.
-
Processed data exits through provided interfaces (lollipops) on the left—services the component delivers to others.
-
The enclosing “box” can represent the entire system, a subsystem, or a nested component, offering flexible granularity for different modeling needs.
Basic Concepts of Component Diagram
A component represents a replaceable, modular part of a system that encapsulates its internal workings. In UML 2, components are drawn as rectangles with optional compartments. Practitioners typically model them in three ways:
-
A simple rectangle with the component’s name
-
A rectangle featuring the component icon
-
A rectangle with stereotype text and/or icon for semantic clarity

Architect Your Modular Systems with AI
One standout feature reviewers highlight is Visual Paradigm’s AI Chatbot integration. By describing your modules or microservices in plain language, the AI can help:
-
Define Modular Boundaries: Identify logical encapsulation points
-
Map Dependencies: Visualize interactions between executables and libraries
Chat with AI Now
Learn more: AI Component Guide All AI Tools
Interface: The Glue Between Components
Interfaces are where component diagrams truly shine. Two key types emerge in practice:
-
Provided Interface (lollipop symbol): Represents services a component offers to others—implemented via a realization relationship.
-
Required Interface (socket symbol): Represents services a component depends on from others.

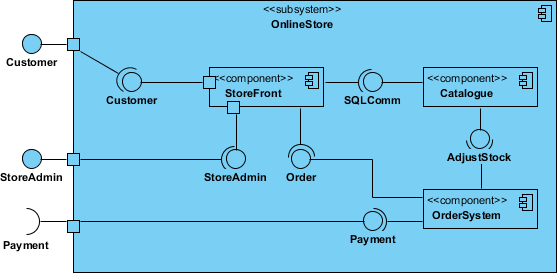
Component Diagram Example – Using Interface (Order System)

This order system example demonstrates how interfaces create clear contracts between components like OrderProcessing, PaymentService, and InventoryManager—making dependencies explicit and testable.
Subsystems and Ports: Scaling Your Model
Subsystems
Subsystems are specialized components that group related functionality. Notationally, they use the <<subsystem>> keyword instead of <<component>>, inheriting all component rules while signaling a higher-level architectural boundary.
Ports
Ports (small squares on component edges) help expose interfaces cleanly. They’re particularly useful when modeling complex components with multiple interaction points, keeping diagrams readable and focused.

Relationships: Connecting the Dots
Component diagrams use standard UML relationships to express how parts interact. Here’s a practitioner’s reference:
| Relationships | Notation |
|---|---|
| Association: Specifies semantic relationships between typed instances. Multiple ends can share the same type. |  |
| Composition: Strong aggregation where parts belong to at most one composite; deleting the composite deletes its parts. |  |
| Aggregation: Shared aggregation relationship, less strict than composition. |  |
| Constraint: Conditions or restrictions expressed in natural language or machine-readable format. |  |
| Dependency: Indicates that one element requires another for specification or implementation. |  |
| Generalization: Taxonomic relationship where a specific classifier inherits features from a general one. |  |
Modeling Real-World Scenarios
Modeling Source Code
Practitioners use component diagrams to:
-
Model source files as
<<file>>stereotyped components -
Group files into packages for large systems
-
Add tagged values for version, author, or last-modified metadata
-
Map compilation dependencies using dependency arrows
Component Example – Java Source Code

Component Diagram Example – C++ Code with versioning

Modeling an Executable Release
When planning releases:
-
Identify components per node or distribution scope
-
Apply stereotypes (executable, library, table, etc.) with visual cues
-
Model interface exports/imports explicitly—or elide to dependencies for higher abstraction

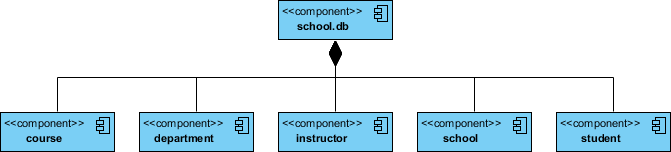
Modeling a Physical Database
For database design:
-
Map logical schema classes to physical tables
-
Consider data distribution strategies
-
Create component diagrams with
<<table>>stereotypes -
Leverage tools to transform logical designs into physical implementations
What is a Deployment Diagram?
Shifting focus from software modules to hardware topology, Deployment Diagrams show how runtime processing nodes are configured and which components reside on them. They model the static deployment view—essentially, the hardware topology of your system.

Learn UML Faster, Better and Easier
(Tooling recommendation remains consistent—Visual Paradigm supports both diagram types seamlessly.)
When to Use Deployment Diagrams: A Practitioner’s Checklist
Deployment diagrams answer critical infrastructure questions:
-
What existing systems will integrate with the new system?
-
How robust must the system be (e.g., redundancy for failover)?
-
Who/what will interact with the system, and how?
-
What middleware, OS, and protocols will be used?
-
What hardware/software will end users directly interact with?
-
How will the system be monitored post-deployment?
-
What security measures (firewalls, physical security) are required?
Purpose and Key Elements
Deployment diagrams serve to:
-
Show runtime system structure
-
Capture hardware elements and their interconnections
-
Model physical components and communication paths
-
Plan system architecture
-
Document software deployment across nodes
Core Notations
-
Nodes: 3D boxes representing hardware/software execution environments; stereotyped for clarity (e.g.,
<<server>>,<<device>>) -
Connections: Lines between nodes, optionally stereotyped with protocols (e.g.,
<<TCP/IP>>) -
Nesting: Nodes can contain other nodes or artifacts
-
Relationships: Dependencies, associations, notes, and constraints

AI-Powered Deployment Planning
Visual Paradigm’s AI tools extend naturally to deployment modeling. By describing your server clusters, cloud platforms, or embedded hardware to the AI Chatbot, you can rapidly generate editable diagrams that visualize software distribution across physical infrastructure.
AI Deployment Capabilities:
• Identify hardware nodes & devices
• Model communication protocols
• Visualize artifact distribution
• Plan system installation topology
Explore AI Capabilities Full AI Ecosystem
Modeling Strategies by System Type
Embedded Systems
-
Identify unique devices/nodes
-
Use stereotypes with icons for unusual hardware
-
Distinguish processors (host software) from pure devices
-
Model relationships and component-to-node mappings
-
Expand complex devices with nested deployment diagrams

Client/Server Systems
-
Identify client and server processor nodes
-
Highlight architecturally significant devices (e.g., card readers)
-
Apply stereotyping for visual clarity
-
Model topology and component-to-node relationships
The example shows a classical HR system architecture:

TCP/IP Client / Server Example

Distributed Systems
-
Identify devices/processors as in client/server modeling
-
Model communication devices in detail if assessing network performance
-
Use packages for logical node groupings
-
Leverage tools that auto-discover network topology
-
Add use case/interaction diagrams for dynamic behavior modeling
-
Reify the network itself as a node (e.g., Internet, LAN) when helpful
Example of a fully distributed system topology:

Corporate Distributed System Example

Deployment Planning Checklist
When drafting deployment plans, practitioners find this checklist invaluable:
Installation Strategy
-
Who installs? Estimated duration?
-
Potential failure points?
-
Rollback procedure and timing?
-
Installation window constraints?
-
Pre-installation backups required?
-
Data conversion needs?
-
Success validation criteria?
Version Management
-
How to handle concurrent production versions?
Physical Deployment
-
Target sites and deployment order?
-
Support staff training plan?
-
Production support environment simulation?
User Enablement
-
User training approach?
-
Documentation formats, languages, and update mechanisms?
Component Diagram vs. Deployment Diagram: A Practical Comparison
Both diagrams model physical aspects of object-oriented systems, but they operate at different layers:
| Feature | Component Diagram | Deployment Diagram |
|---|---|---|
| Primary Focus | Software modules and logical organization | Hardware topology and software distribution |
| Key Elements | Components, Interfaces, Dependencies | Nodes (servers/devices), Artifacts, Communication Paths |
| Level of Abstraction | Medium: Functional roles and contracts | Low: Actual hardware and network interactions |
| Typical Users | Software developers, architects | Network engineers, system administrators, DevOps |
When to Use Each
Use a Component Diagram when you need to:
-
Visualize replaceable software modules and their internal structure
-
Define APIs and interface contracts between components
-
Plan code organization into libraries, executables, or packages
-
Model during design and implementation phases
Use a Deployment Diagram when you need to:
-
Plan physical runtime architecture and hardware allocation
-
Map artifacts (
.jar,.dll, containers) to specific hardware nodes -
Document network connections and communication protocols
-
Assess resource allocation, scalability, and distribution implications
How They Complement Each Other
-
Shared Goal: Both model physical (not behavioral) system aspects
-
Connected Content: Components from component diagrams often appear as artifacts within deployment diagram nodes
-
Unified Notation: Both use rectangles for software elements and lines for relationships
💡 Pro Tip: Start with component diagrams to define your software architecture, then layer deployment diagrams to map those components onto your infrastructure. This two-step approach keeps concerns separated and models maintainable.
Creating Diagrams in Visual Paradigm: A Hands-On Review
Creating Deployment Diagrams
-
Start Fresh: Diagram > New > Search “Deployment Diagram”
-
Add Nodes: Use the 3D cube-shaped Node tool from the palette
-
Place Artifacts: Drag
.jar,.exe, or component artifacts onto nodes -
Connect Nodes: Use the Resource Catalog to draw communication paths with protocol stereotypes
-
Refine: Add notes, constraints, or stereotypes like
<<HTTPS>>for clarity
Creating Component Diagrams
-
Initialize: Diagram > New > Component Diagram
-
Add Components: Place component shapes; nest them for hierarchical modeling
-
Define Interfaces:
-
Provided: Drag Realization → Interface (lollipop) from Resource Catalog
-
Required: Connect via Dependency → Interface (socket)
-
-
Manage Visibility: Use Presentation Options to toggle attributes/operations
Key Features Practitioners Appreciate
-
Resource Catalog: One-click creation and connection of elements
-
AI Integration: Generate initial diagrams from text descriptions via chatbot
-
Templates: Pre-built patterns for web apps, client-server, cloud architectures
-
Free Tier: Community Edition and VP Online Free support both diagram types for non-commercial use
Visual Paradigm Online Templates
Conclusion
After evaluating numerous modeling approaches and tools, Component and Deployment Diagrams emerge as indispensable allies for anyone serious about system architecture. Component diagrams bring clarity to what your system is made of and how modules interact, while deployment diagrams answer where those modules run and how they communicate across hardware boundaries.
The true power lies in using them together: define your modular software architecture first, then map it onto your physical infrastructure. Tools like Visual Paradigm—especially with emerging AI assistance—lower the barrier to entry while supporting enterprise-grade modeling needs.
Whether you’re designing a cloud-native microservices platform, an embedded IoT system, or a traditional client-server application, investing time in these diagrams pays dividends in communication, documentation, and ultimately, system reliability. Start small, iterate with your team, and let these visual models become the shared language that aligns developers, architects, and operations staff toward a common technical vision.
References
- Component Diagram Tutorial: A step-by-step guide to creating and understanding UML component diagrams with practical examples.
- What is Component Diagram?: Comprehensive overview of component diagram concepts, notation, and modeling strategies.
- What is Deployment Diagram?: Detailed explanation of deployment diagrams, their purpose, and when to use them.
- Beginner’s Guide to Deployment Diagrams: Accessible tutorial for newcomers to deployment modeling with Visual Paradigm Online.
- How to Draw Deployment Diagram in UML: Practical walkthrough for creating deployment diagrams with notation guidance.
- Visual Paradigm User Guide: Component Diagram: Official documentation on component diagram features and usage in Visual Paradigm.
- Visual Paradigm User Guide: Deployment Diagram: Official documentation on deployment diagram creation and customization.
- Drawing Component Diagrams: Step-by-step instructions for building component diagrams in Visual Paradigm desktop.
- Visual Paradigm Online: Free Deployment Diagram Tool: Overview of free online tooling for deployment diagram creation.
- Deployment Diagram Software Features: Feature breakdown of Visual Paradigm’s deployment diagram capabilities.
- Exploring Visual Paradigm Online: In-depth review of Visual Paradigm Online’s diagramming ecosystem.
- Software Design Handbook: Deployment Diagram: Handbook section covering deployment diagram best practices.
- AI Component Diagram Generator Guide: Tutorial on leveraging AI to generate component diagrams via conversational interface.
- Best AI Diagram Generator Ecosystem: Overview of Visual Paradigm’s AI-powered diagramming tools and capabilities.
- Visual Paradigm AI Features: Product page detailing AI-assisted diagram generation features.
- Visual Paradigm Homepage: Official website for Visual Paradigm UML modeling tools and resources.
- YouTube: Component Diagram Tutorial: Video walkthrough of component diagram creation and concepts.
- YouTube: Deployment Diagram Tutorial: Video guide to building and understanding deployment diagrams.