
Introduction
Computational thinking is not a synonym for computer programming. It is a disciplined approach to problem-solving that borrows concepts from computer science to break down complex problems, understand their core mechanics, and develop solutions that can be executed by either a human or a machine . The central premise is simple yet powerful: before you write a single line of code or draw a single shape, you must first learn to think clearly about the problem itself.
This guide provides a comprehensive walkthrough of computational thinking and its most tangible output: the flowchart. We will explore the core cognitive skills—decomposition, pattern recognition, abstraction, and algorithm design—and then demonstrate how to translate those ideas into visual models using modern tooling, including Visual Paradigm’s AI-assisted diagramming and diagram-as-code workflows with PlantUML and VPasCode.
Key Concepts of Computational Thinking
Computational thinking rests on a set of interrelated mental tools. While different frameworks emphasize slightly different labels, the following four components form the widely accepted core .
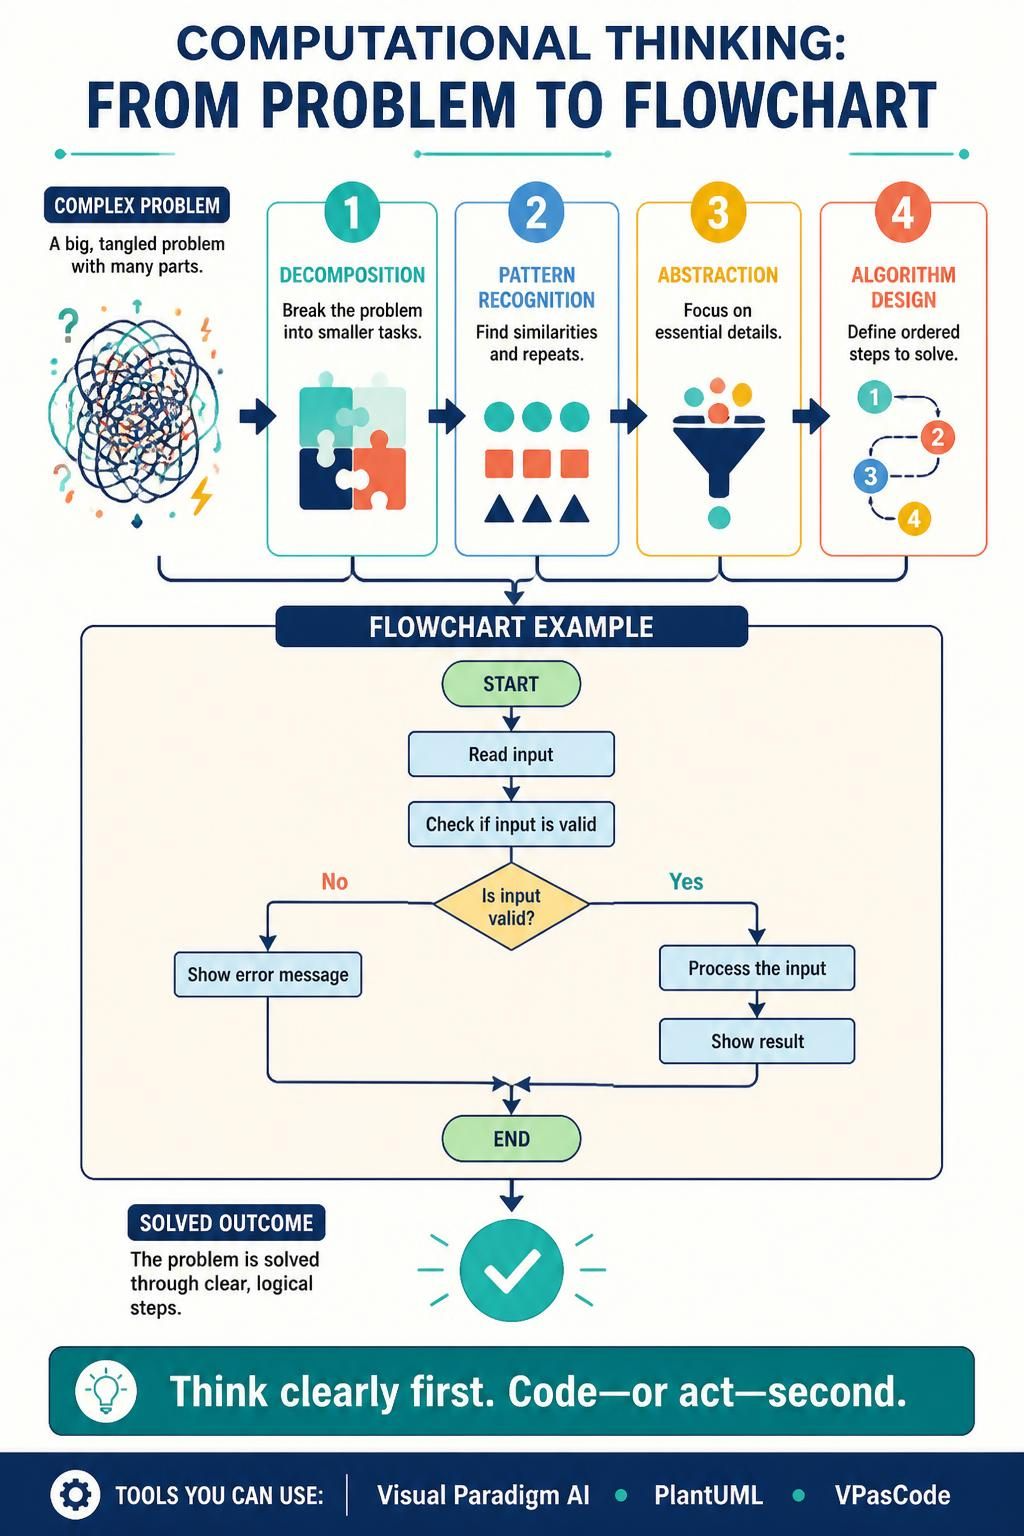
Decomposition
Decomposition is the act of breaking a large, unwieldy problem into smaller, manageable parts. If you are tasked with building a house, you do not start by swinging a hammer at a pile of lumber. You decompose the project into foundation work, framing, electrical, plumbing, and finishing. Each of those can be further broken down until every task is small enough to understand and execute .
Example: A customer support ticketing system can be decomposed into ticket submission, validation, assignment to an agent, resolution, and closure. Each module can then be designed and built independently .
Pattern Recognition
Pattern recognition is the ability to observe similarities, trends, or regularities within a problem or across different problems. Recognizing that a new problem shares structural features with one you have already solved allows you to reuse solutions rather than reinventing them .
Example: In a ticketing system, you may notice that invalid tickets follow predictable patterns—missing contact information, malformed email addresses, or duplicate submissions. Recognizing these patterns allows you to build validation rules that catch them automatically.
Abstraction
Abstraction is the process of filtering out irrelevant details to focus on the essential structure of a problem. A subway map is a classic example: it does not show geographic accuracy, street layouts, or building heights. It shows only stations and connections—the information you actually need to navigate .
Example: When modeling a flowchart for ticket resolution, you do not need to represent the color of the agent’s desk or the font used in the email notification. You abstract the process down to the decision points and actions that determine the outcome.
Algorithm Design
An algorithm is a precise, step-by-step sequence of instructions for solving a problem or completing a task. Algorithmic thinking means designing a solution that is unambiguous, finite, and effective—whether the executor is a computer or a human following a procedure .
Example: The algorithm for ticket processing might be: receive ticket → validate → if invalid, notify sender and stop → if valid, assign to agent → agent resolves → if resolved, close ticket → if unresolved, escalate.
From Concepts to Flowcharts: Visualizing the Algorithm
A flowchart is the most direct visual representation of an algorithm. It uses standard symbols—rectangles for processes, diamonds for decisions, arrows for flow—to make the logic of a solution visible and reviewable. This is where computational thinking transitions from mental model to tangible artifact.
Tooling Path 1: AI-Assisted Flowchart Generation in Visual Paradigm
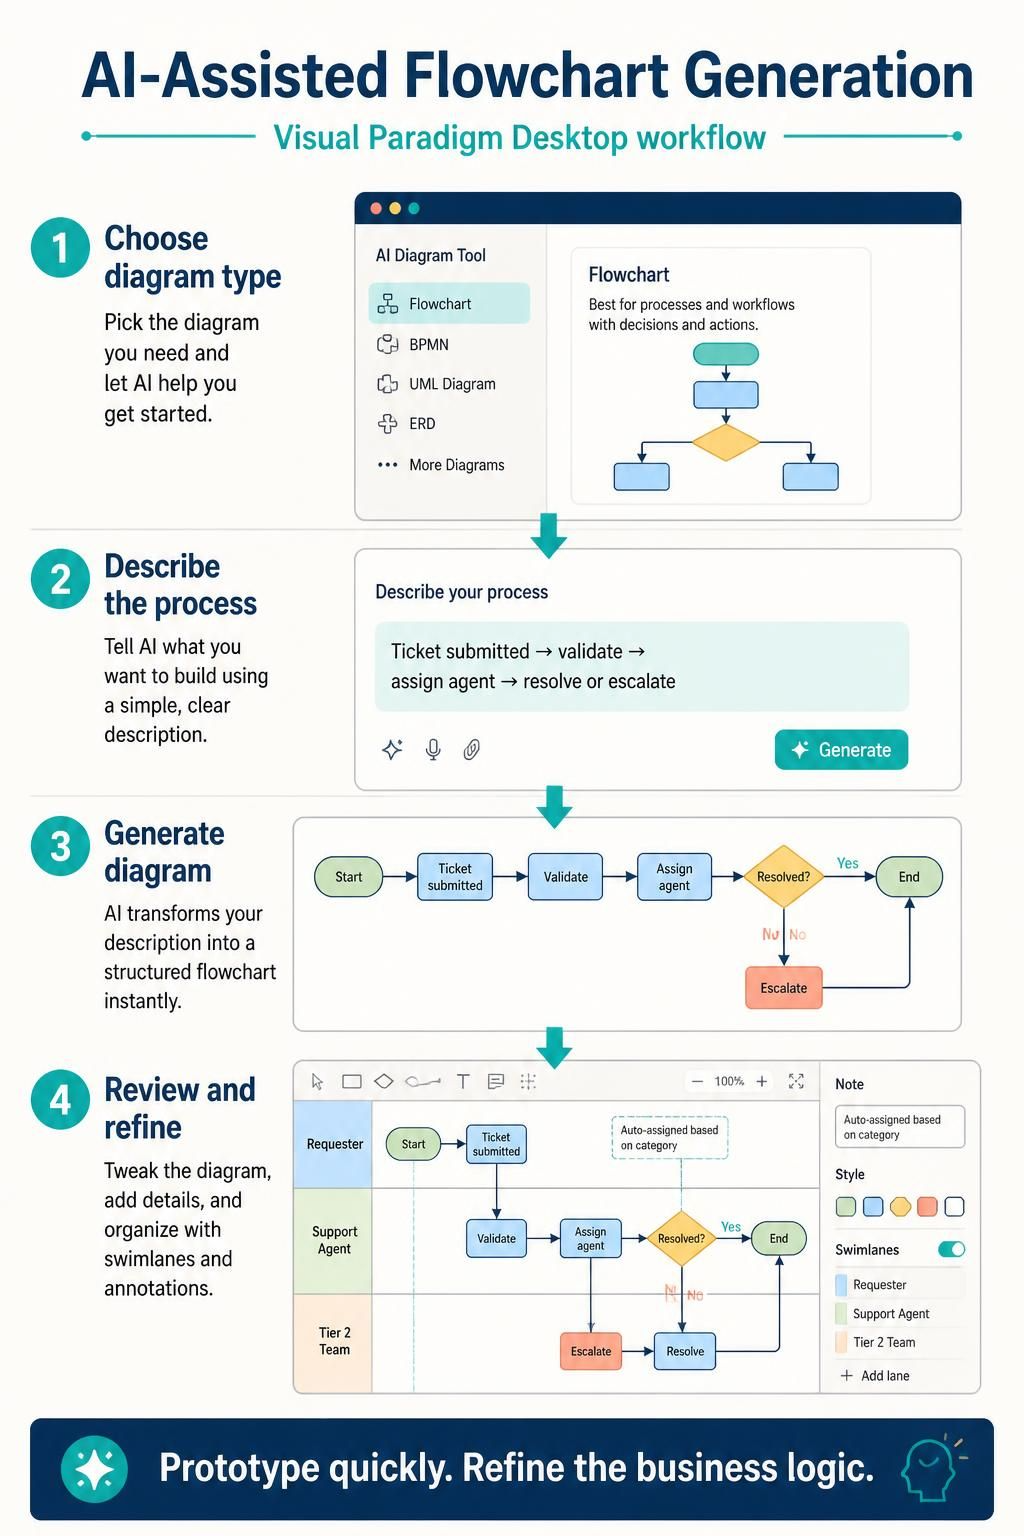
Visual Paradigm’s desktop application includes an AI flowchart generator that converts natural language descriptions into structured diagrams. The workflow is straightforward :
-
Open the AI Diagram Tool in Visual Paradigm Desktop and select “Flowchart” as the target diagram type.
-
Input a plain-text description of your process. The more specific you are about conditions and actions, the more accurate the output. For example: “Create a flowchart for a customer support ticketing system. A ticket is submitted, then checked for validity. If invalid, it is rejected and the process ends. If valid, it is assigned to an agent. The agent attempts resolution. If resolved, the ticket is closed. If not resolved, it is escalated.”
-
Generate the flowchart. The AI identifies verbs as actions (rectangles) and conditional phrases (“if,” “when,” “depending on”) as decision points (diamonds), then constructs the diagram automatically .
-
Review and refine the output in the visual editor. Adjust shape placement, add annotations, or introduce swimlanes to assign responsibilities.
This approach is ideal for rapid prototyping and brainstorming. It reduces the initial effort of diagram construction by roughly 80%, allowing you to focus on refining the business logic rather than wrestling with alignment tools .
Tooling Path 2: Diagram-as-Code with PlantUML and VPasCode
For teams that treat documentation as a first-class engineering artifact, diagram-as-code (DaC) offers a more maintainable approach. Instead of drawing shapes, you write structured text that a rendering engine converts into a diagram.
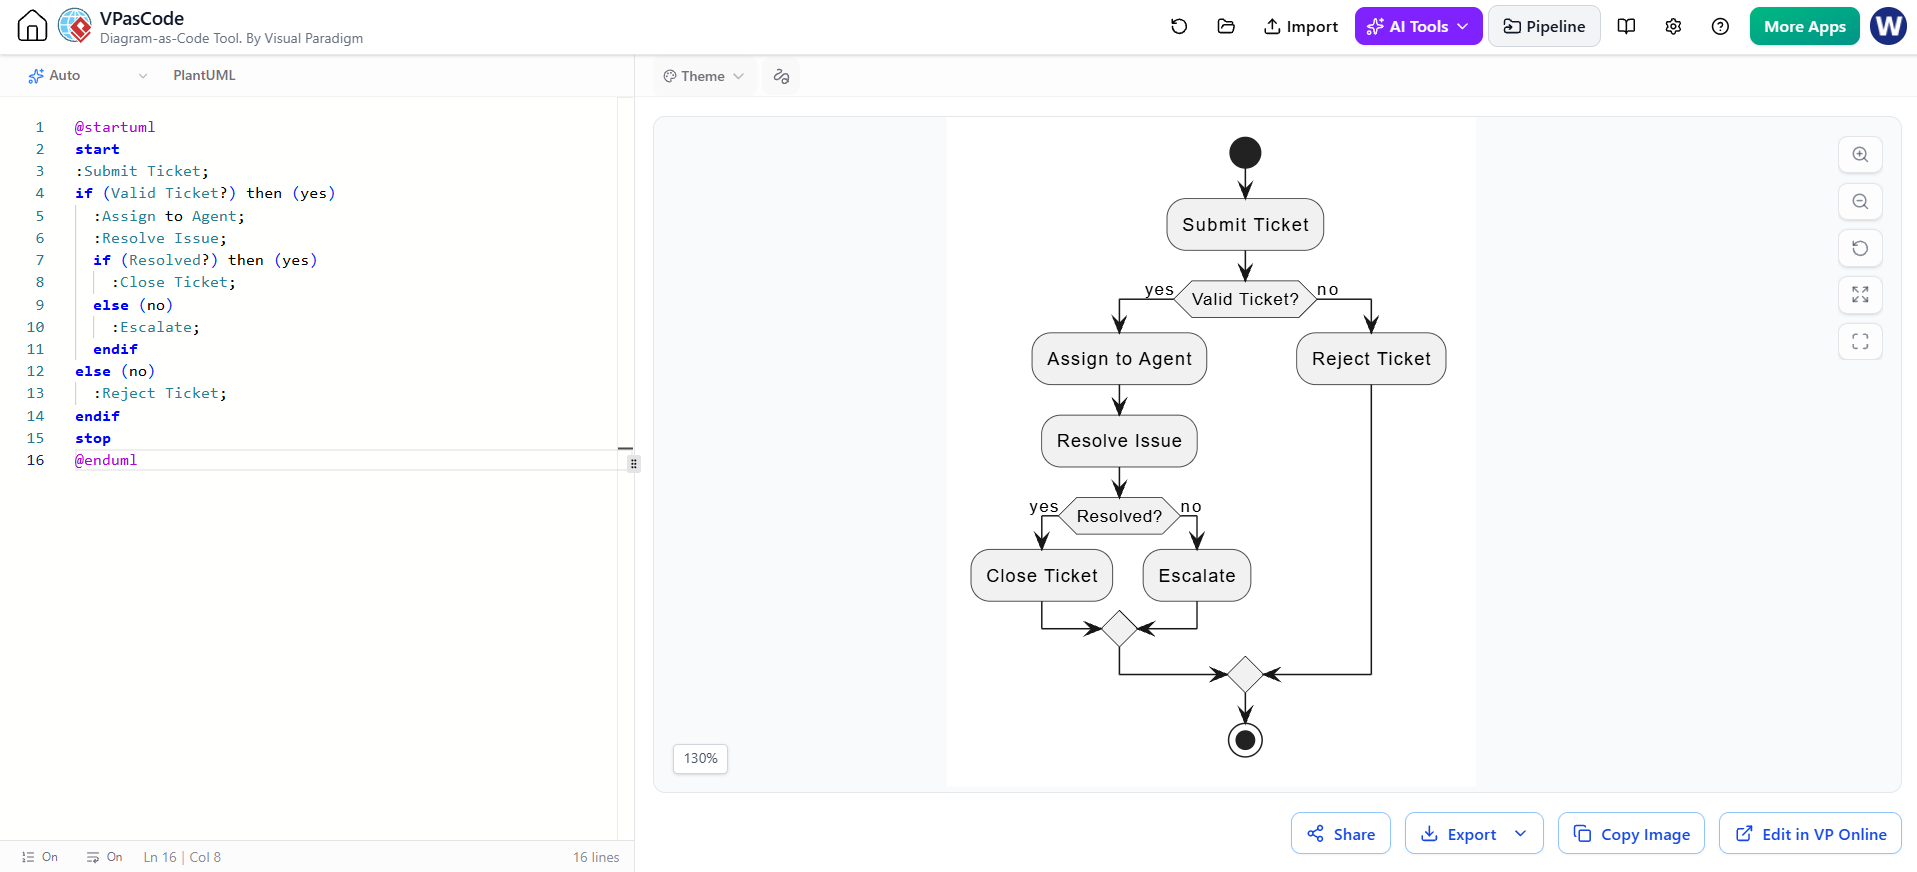
PlantUML is a mature, widely used syntax for creating UML and activity diagrams from text. A simple activity diagram for the ticket workflow might look like this:
Generating Flowchart as Code in PlantUML with VPasCode Tool:
@startuml
start
:Submit Ticket;
if (Valid Ticket?) then (yes)
  :Assign to Agent;
  :Resolve Issue;
  if (Resolved?) then (yes)
    :Close Ticket;
  else (no)
    :Escalate;
  endif
else (no)
  :Reject Ticket;
endif
stop
@enduml
This text is version-controllable, diffable, and reviewable in a pull request. VPasCode, powered by Visual Paradigm, provides a unified workspace that renders PlantUML, Mermaid.js, and Graphviz syntax in real time without local setup . You can paste the PlantUML snippet above into VPasCode and immediately see the corresponding flowchart, then export it as a high-resolution vector graphic or share it via URL.
The advantage of this workflow is consistency and automation. Because the diagram is defined by text, it can be regenerated whenever the underlying logic changes, ensuring that documentation never drifts out of sync with reality .
Conclusion
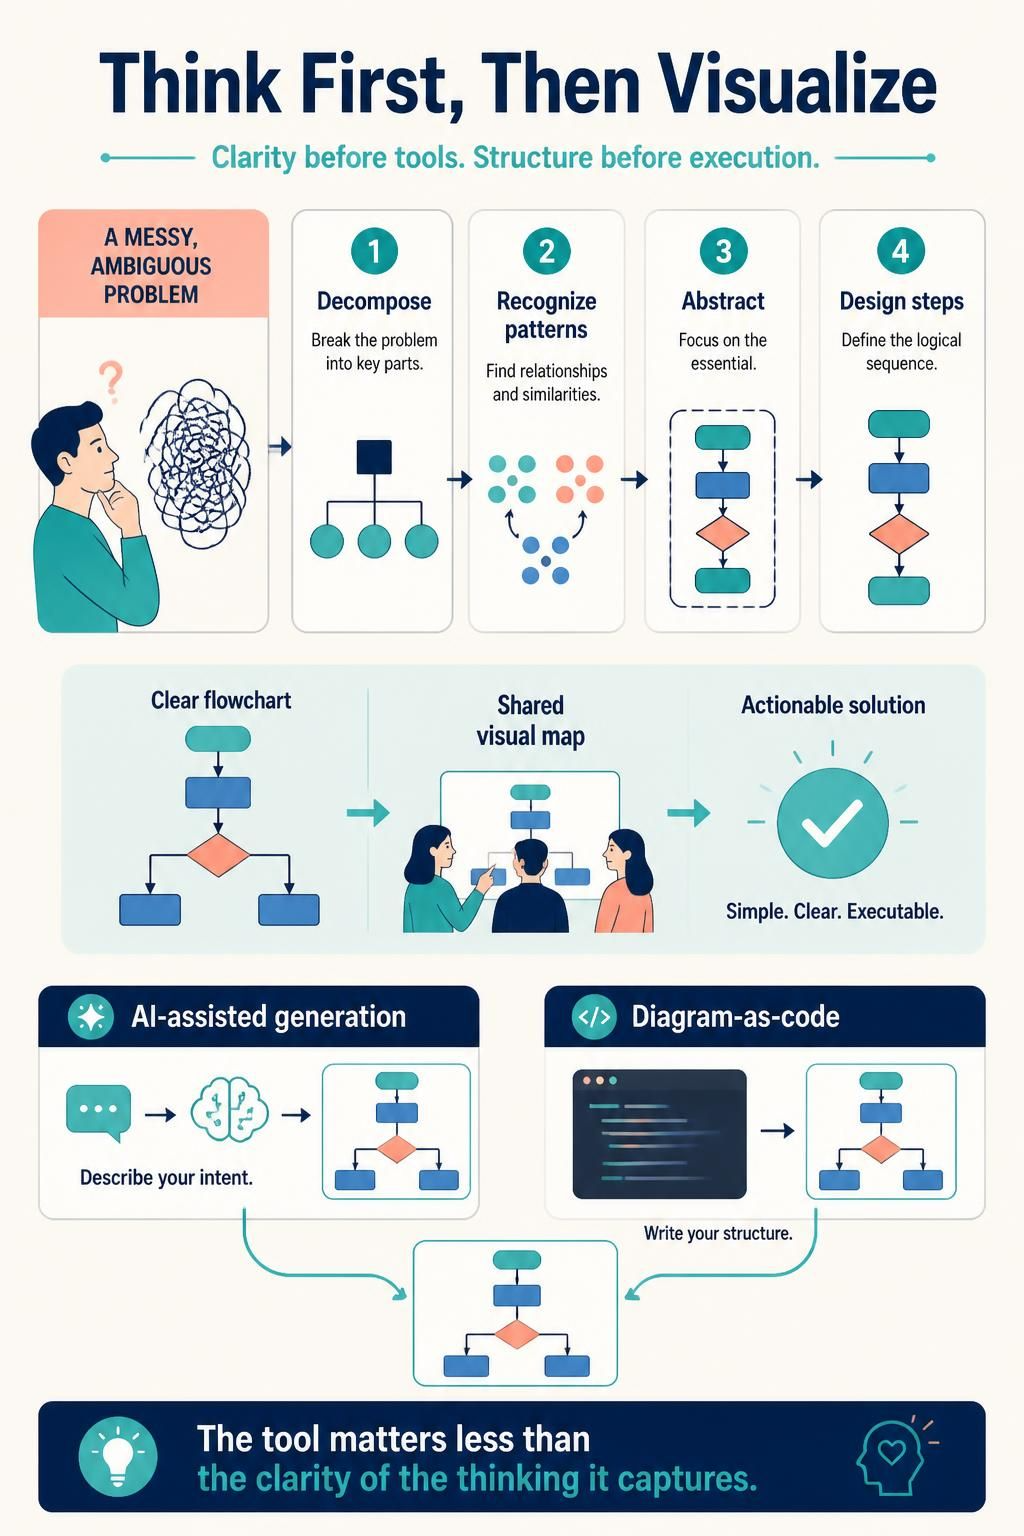
Computational thinking is a foundational skill that extends far beyond the keyboard. It is the ability to look at a messy, ambiguous problem and see the structure beneath—to decompose it, recognize patterns, abstract away noise, and design a clear sequence of steps toward a solution. Flowcharts serve as the bridge between that internal cognitive process and external communication.
Whether you choose the speed of AI-assisted generation in Visual Paradigm or the precision and maintainability of diagram-as-code with PlantUML and VPasCode, the underlying discipline remains the same: think first, then visualize. The tool you use matters less than the clarity of the thinking it captures.
Reference
-
Introduce Stepwise Flowcharts: AI-Powered Process Mapping: Official release announcement for the stepwise flowchart feature, demonstrating AI-generated color-coded workflow phases using a customer service process example, and covering VPasCode editing and OpenDocs publishing integration.
-
How to Create Flowcharts with AI in Visual Paradigm Online OpenDocs: Tutorial on generating flowcharts with AI in the OpenDocs document environment, covering both reusable component pages and single-page insertion methods, emphasizing the tight integration of process models with technical documentation.
-
How to Generate Flowcharts Using AI in Visual Paradigm: Step-by-step walkthrough of AI flowchart generation in the desktop version, covering the workflow from text outline input to automatic layout, with standardized application of shapes such as processes, decisions, and input/output.
-
How to Create BPMN Business Process Diagrams in Visual Paradigm: Detailed BPMN diagram creation tutorial for the desktop version, covering Pools/Lanes organization, Resource Catalog rapid connections, gateway types, and process simulation animation analysis.
-
Modeling BPMN Diagrams with Visual Paradigm Desktop: BPMN modeling guide focused on practical operations, covering event/task/gateway placement, swimlane organization, smart connections, validation rules, and multi-format export.
-
AI BPMN Diagram Generator Guide: Introduces the AI BPMN generator for the desktop version, supporting automatic generation of BPMN 2.0-compliant process diagrams from plain language descriptions, with optional automatic inclusion of Pools and Lanes, and subsequent manual refinement using professional editing tools.
-
How AI Is Transforming Business Process Modeling (BPM): Explores the value of AI in BPM, covering rapid prototyping, reduction of structural errors, conversational iterative optimization, and the necessity of linking AI-generated drafts with system architecture and data models within an integrated modeling ecosystem.
-
Online BPMN Tool: Feature overview page for the online BPMN tool, covering drag-and-drop editing, Visio import, MS Office integration, 2000+ templates, and real-time collaboration capabilities.
-
Next-Gen AI Diagram Chatbot V2 Launched: Introduces AI chatbot V2 upgrades, including automatic validation and self-recovery, flowchart and multi-diagram type support, the Artifacts Pane, and generated diagram explanations and analysis features.