


In the era of smart homes and IoT-driven comfort, smart thermostats stand as one of the most successful examples of embedded systems that blend user convenience, energy efficiency, and autonomous decision-making. Devices like Nest, Ecobee, or Honeywell Home not only respond to direct commands but also learn from patterns, adapt to schedules, detect environmental changes, and gracefully recover from faults such as power interruptions or sensor failures.
At the heart of such a device lies its control logic — a reactive, event-driven behavior that must reliably handle diverse scenarios: a user manually overriding a schedule, a daily program kicking in at 7 AM, the room temperature drifting outside the comfort zone, or the system entering a safe shutdown after detecting a hardware issue.
While flowcharts or pseudocode can sketch parts of this logic, they quickly become tangled when dealing with overlapping conditions, priority of events, and recovery paths. This is where UML State Machine Diagrams (also called Statecharts) prove invaluable. They offer a precise, visual, and executable specification of the system’s lifecycle — defining exactly which states are valid, what events trigger changes, under what conditions transitions occur, and what actions are performed on entry, exit, or during a state.
This case study examines a realistic smart thermostat workflow modeled as a UML State Machine Diagram using PlantUML notation. The example captures core operational modes (Idle, user configuration, automatic scheduling, manual override), fault tolerance (Error state), and power management (Disabled state), while illustrating fundamental UML concepts such as:
- Initial and final pseudostates
- Event-triggered transitions
- Hierarchical potential (implied for future substates like Heating/Cooling)
- Clear separation of user-driven vs. system-driven behavior
- Explicit error and termination handling
By dissecting this diagram, we demonstrate how state machines bring clarity to embedded system design, reduce implementation bugs, enable formal verification, and serve as living documentation for developers, testers, and stakeholders.
Furthermore, we explore how modern AI-assisted tools — particularly Visual Paradigm’s AI State Machine Diagram Chatbot/Generator — dramatically accelerate the creation, refinement, and extension of such models. What once took hours of manual drawing can now begin with a single natural-language description and evolve through iterative conversation, producing professional, standards-compliant diagrams in minutes.
Whether you’re designing firmware for the next generation of connected home devices, teaching reactive system principles, or simply seeking a robust way to specify dynamic behavior, this case study provides both a practical reference model and a blueprint for leveraging UML state machines effectively in real-world projects.
Let’s dive into the thermostat’s lifecycle — from powered-on idle to autonomous comfort control and graceful failure recovery.
This comprehensive case study explores how UML State Machine Diagrams (also known as Statecharts) can precisely model the dynamic behavior of a smart thermostat — a common embedded IoT device in smart homes. The provided PlantUML code represents a realistic lifecycle that balances user control, automated operation, error handling, and power management.
We will cover:
-
Real-world context & motivation
-
Key UML State Machine concepts demonstrated
-
Detailed breakdown of the diagram
-
Step-by-step guidelines for creating such diagrams
-
Benefits & common extensions
-
How Visual Paradigm’s AI State Machine Diagram Chatbot / Generator can accelerate and improve the entire modeling process

1. Business & Technical Context
Modern smart thermostats (e.g., Nest, Ecobee, Honeywell Home) must:
-
Respond to user inputs (set temperature, switch modes, power off)
-
Operate autonomously based on schedules, learned patterns, or current room temperature
-
Handle faults gracefully (sensor failure, network loss, power outage)
-
Minimize energy consumption
Trying to express this behavior with only code comments or flowcharts quickly leads to unmaintainable logic. A UML State Machine Diagram provides:
-
A visual, executable specification
-
Clear definition of valid states & transitions
-
Prevention of invalid sequences (e.g., can’t heat when powered off)
-
Basis for code generation, simulation, and formal verification
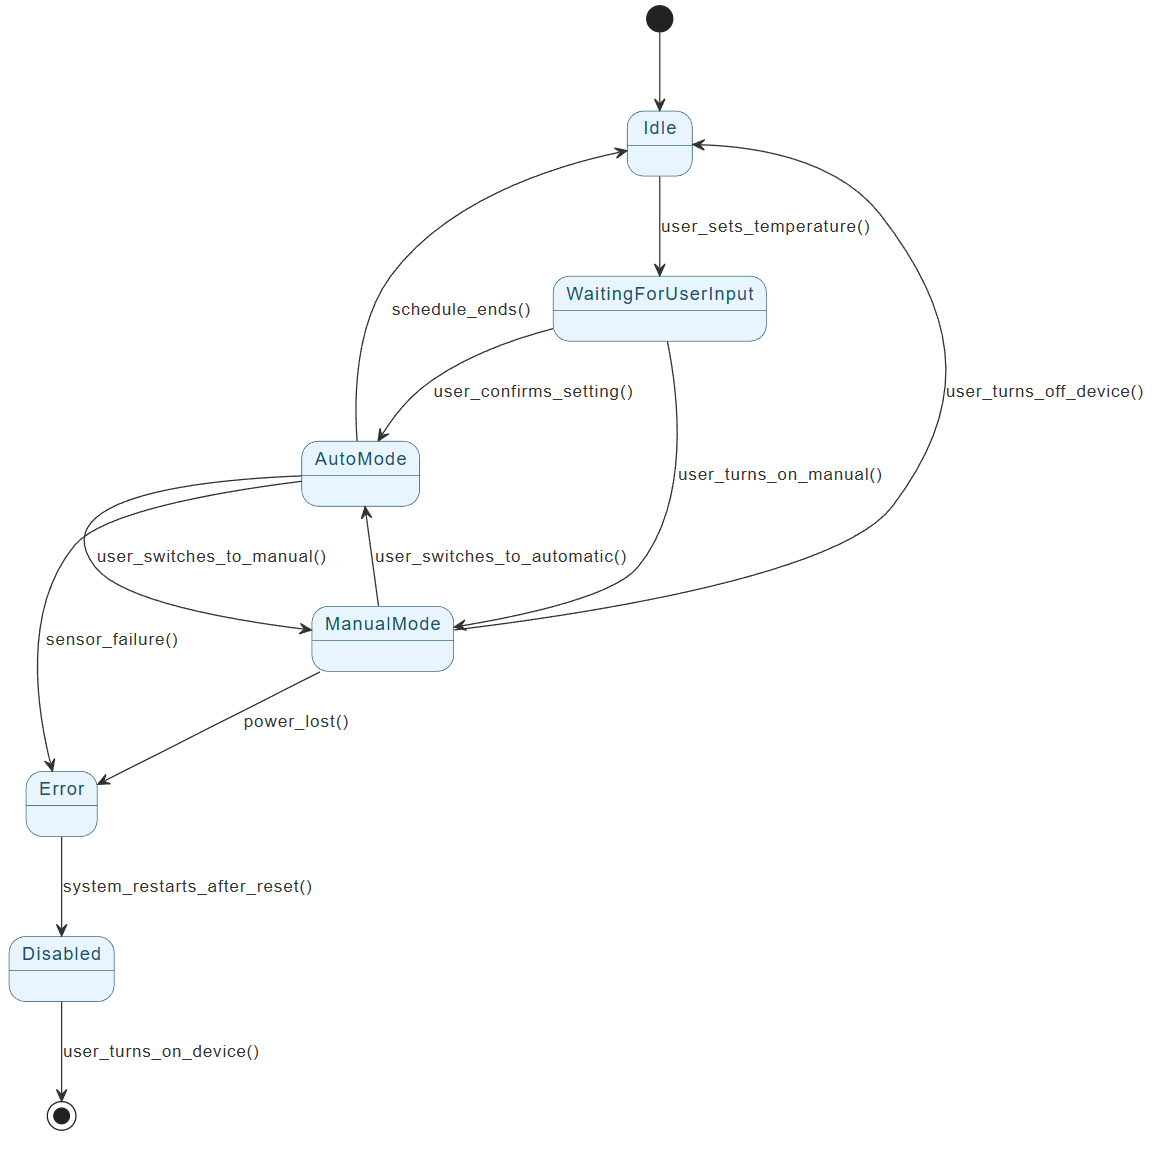
The diagram below captures a typical smart thermostat lifecycle in a clean, hierarchical, and event-driven way.
Provided PlantUML Diagram (Smart Thermostat)
@startuml

skinparam {
  ' Overall style
  ' Colors
  ArrowColor #333333
  ArrowFontColor #333333
  BackgroundColor #FFFFFF
  BorderColor #333333

  ' State styling
  State {
    BorderColor #005073
    BackgroundColor #E6F5FF
    FontColor #005073
  }
}

[*] --> Idle

Idle --> WaitingForUserInput : user_sets_temperature()
WaitingForUserInput --> AutoMode : user_confirms_setting()
WaitingForUserInput --> ManualMode : user_turns_on_manual()

AutoMode --> Idle : schedule_ends()
AutoMode --> ManualMode : user_switches_to_manual()
ManualMode --> AutoMode : user_switches_to_automatic()
ManualMode --> Idle : user_turns_off_device()

AutoMode --> Error : sensor_failure()
ManualMode --> Error : power_lost()

Error --> Disabled : system_restarts_after_reset()
Disabled --> [*] : user_turns_on_device()

@enduml
2. Key UML State Machine Concepts Demonstrated
| Concept | Description | How it Appears in the Diagram | Why It Matters |
|---|---|---|---|
| Initial Pseudostate | Starting point of the state machine | [*] --> Idle |
Defines unambiguous entry point |
| Simple States | Atomic states with no substates | Idle, WaitingForUserInput, Error, Disabled |
Basic operational modes |
| Composite States (implied) | States that can contain substates (not shown here but common) | AutoMode and ManualMode could be composites with substates like Heating/Cooling |
Supports hierarchical modeling |
| Transitions | Directed arrows showing change from source to target state | e.g., Idle --> WaitingForUserInput : user_sets_temperature() |
Models event-driven behavior |
| Triggers / Events | What causes a transition (user action, timer, sensor reading) | user_sets_temperature(), sensor_failure(), power_lost() |
Makes behavior explicit |
| Guards (not shown here) | Boolean conditions on transitions | Could be added, e.g., [currentTemp < setTemp - hysteresis] |
Prevents invalid transitions |
| Terminal / Final State | End of the lifecycle (can be multiple) | Disabled --> [*] |
Explicitly models shutdown |
| Self-Transitions (not shown) | Transition from a state back to itself | Useful for e.g., AutoMode --> AutoMode : temperature_changed() |
Handles internal changes |
| Entry / Exit / Do Activities (not shown) | Actions on state entry, exit, or while in state | e.g., Heating : entry / turnOnHeater() |
Encapsulates side effects |
3. Detailed Breakdown of the Smart Thermostat States
| State | Meaning / Responsibilities | Entry/Exit Actions (typical) | Possible Triggers Outgoing |
|---|---|---|---|
| Idle | Powered on, no active control, monitoring environment | — | User interaction |
| WaitingForUserInput | User is actively configuring (set temp, schedule, mode) | Display UI, show current settings | Confirm / Cancel |
| AutoMode | Running on schedule or AI-based adaptive control | Load schedule, start temp regulation | Schedule end, manual override, fault |
| ManualMode | User has forced a specific temperature | Hold fixed setpoint, ignore schedule | Switch to auto, turn off, fault |
| Error | Fault detected (sensor fail, comms loss, power issue) | Log error, show alert on display | Reset / Restart |
| Disabled | User explicitly powered off; no operation | Save last settings, enter low-power sleep | Power on |
4. Step-by-Step Guidelines for Creating a State Machine Diagram
-
Identify the Object / System
→ Focus on one entity (here:ThermostatController). -
List Main States
→ Brainstorm lifecycle phases (Idle → Active modes → Error/Off). -
Define Transitions & Triggers
→ Ask: “What event causes a change from this state?”
→ Include user events, timers, sensor readings. -
Add Guards (if needed)
→ Conditions like[temperature < 18°C]. -
Specify Actions
→ Entry/exit/do activities (e.g., turn on fan, log event). -
Use Hierarchy (Composite States)
→ GroupHeating/CoolinginsideAutoMode. -
Handle Errors & Termination
→ Always include error recovery and final states. -
Validate
→ Ensure no dead states, unreachable states, or invalid transitions. -
Iterate & Refine
→ Add orthogonal regions (e.g., separate “Display” and “Control” behavior).
5. Real-World Extensions & Best Practices
-
Add Orthogonal Regions
→ One region forHeating/Cooling, another forWi-Fi Connectivity(Connected / Disconnected). -
History Pseudostate
→ Return to last substate (e.g., resumeHeatingafter power restore). -
Timeouts
→Idle --> Disabled : after(30min)(auto power-off). -
Concurrent States
→ Display updates independently of control logic. -
Code Generation
→ Many tools (including Visual Paradigm) can generate state pattern code from the diagram.
6. How Visual Paradigm’s AI State Machine Diagram Generator / Chatbot Automates & Improves This Process
Visual Paradigm (VP) offers one of the most mature AI-powered UML modeling suites in 2026, with dedicated support for State Machine Diagrams via both:
-
AI Diagram Generator (Desktop Professional Edition)
-
AI Chatbot (Online at chat.visual-paradigm.com)
Key Advantages of Using VP AI for This Case Study
-
Instant Generation from Natural Language
Prompt example:“Create a UML State Machine Diagram for a smart thermostat with states: Idle, WaitingForUserInput, AutoMode, ManualMode, Error, Disabled. Transitions: user sets temperature from Idle to WaitingForUserInput, confirm to AutoMode or ManualMode, faults to Error, restart to Disabled, power on from Disabled.”
→ AI generates a clean, editable diagram in seconds — states, transitions, events, and layout.
-
Iterative Refinement via Chat
-
“Add a composite state for AutoMode with substates Heating and Cooling”
-
“Include guards: from Heating to Cooling when [currentTemp > setTemp + 2]”
-
“Add entry action in Heating: turnOnHeater()”
→ Diagram updates live in the chat interface.
-
-
Standards-Compliant & Professional Output
-
Uses correct UML 2.5 notation
-
Auto-applies professional styling (rounded rectangles, proper arrows)
-
Supports hierarchical states, history, entry/exit points
-
-
Dual View & PlantUML Source
-
Right panel: rendered diagram + PlantUML tab
-
Edit PlantUML directly if desired, or export to VP project
-
-
Integration & Export
-
Import generated diagram into VP Desktop for simulation, code generation, traceability
-
Export as PNG/SVG/PDF or embed in documentation
-
-
Learning & Validation Aid
-
Ask: “Explain why we need a final state here” or “Suggest improvements for fault tolerance”
-
Great for students, architects, or teams reviewing IoT device behavior
-
Supported Diagram Types (2026 Status)
VP AI supports 13+ UML & related types, including:
-
State Machine Diagram
-
Requirement, Object, ERD, PERT, Decision Table, C4, ArchiMate, SysML
For smart home / IoT systems, you can quickly generate complementary diagrams (e.g., Component Diagram for hardware modules, Sequence Diagram for user ↔ cloud interaction).
Bottom Line
The Visual Paradigm AI State Machine Diagram Chatbot / Generator transforms a multi-hour manual modeling task into a minutes-long conversation. It eliminates syntax errors, enforces UML standards, and lets you focus on correct behavior rather than drawing arrows. For real-world projects like smart thermostats, this means faster prototyping, better documentation, and fewer bugs in production firmware.
Would you like a refined prompt to generate an enhanced version of this thermostat diagram (with composites, actions, and guards) in Visual Paradigm AI? Or a complementary diagram type?
- Comprehensive Step-by-Step Guide to the 3D Printer State Machine: This guide applies state machine concepts to 3D printing systems, detailing their operational logic and automation pathways.
- Interactive State Machine Diagram Tool: A specialized web-based tool for creating and editing state machine diagrams that leverages GenAI capabilities for real-time behavior modeling.
- Understanding State Machine Diagrams in UML: This tutorial provides a comprehensive overview of modeling system behavior using state machine diagrams in UML.
- Definitive Guide to UML State Machine Diagrams with AI: This resource provides a detailed look at using AI-powered tools to accurately model object behavior with UML state machine diagrams.
- How to Draw a State Machine Diagram in UML?: This tutorial provides detailed instructions for creating diagrams and naming transitions to model entity history and events.
- Mastering State Diagrams with Visual Paradigm AI: A Guide for Automated Toll Systems: This guide provides a walkthrough on using AI-enhanced state diagrams to model and automate the complex logic required for toll system software.
- State Machine Diagram Tutorial: This tutorial explains the symbols and syntax required to model the dynamic behavior of individual class objects, use cases, and entire systems.
- Visual Paradigm AI Suite: A Comprehensive Guide to Intelligent Modeling Tools: This overview details how the platform’s AI Chatbot supports technical modeling, including state machines and other behavioral diagrams.
- Visual Paradigm – UML State Machine Diagram Tool: An overview of a feature-rich online tool designed for architects to build, edit, and export precision state machine models using a cloud-based interface.
- State Diagram Quick Tutorial: Master UML State Machines in Minutes: A beginner-friendly tutorial for creating and understanding state diagrams, focusing on core concepts and practical modeling techniques.