


Introduction: Why Activity Diagrams Matter in Modern Systems Design
In the realm of software engineering and business process modeling, UML (Unified Modeling Language) activity diagrams stand as a cornerstone for visualizing the dynamic behavior of systems. As a type of behavioral diagram, activity diagrams go beyond simple flowcharts—they capture not only the sequence of actions but also the control flow, decision-making, concurrency, object handling, and coordination across multiple actors or threads.
These diagrams are particularly powerful in:
-
Modeling complex workflows in business processes.
-
Realizing use cases with detailed operational logic.
-
Designing procedural operations within object-oriented systems.
-
Supporting cross-functional collaboration through clear visual representation.
With the rise of AI-powered modeling tools like Visual Paradigm, creating, refining, and sharing activity diagrams has evolved from a time-consuming manual task into a streamlined, intelligent, and collaborative process.
When to Use Activity Diagrams: Key Use Cases
Activity diagrams shine in scenarios where understanding control flow, decision points, parallelism, and object movement is critical. Use them when you need to:
✅ Identify and validate use cases by analyzing real-world business workflows.
✅ Document pre- and post-conditions for use cases to define system context and expected outcomes.
✅ Model overlapping or interdependent activities across multiple use cases (e.g., order processing involving billing, shipping, and inventory).
✅ Break down high-level processes into granular, actionable steps for developers and stakeholders.
✅ Visualize complex workflows involving conditional logic, loops, parallel execution, and synchronization.
✅ Communicate responsibilities clearly in multi-actor or multi-threaded environments using swimlanes.
💡 Ideal for: Business process modeling, system workflow design, use-case realization, software development documentation, and process improvement initiatives.
Core Elements and UML Notation: A Deep Dive
Activity diagrams follow a standardized set of symbols defined by the UML specification. Understanding each element ensures accurate, consistent, and professional modeling.

| Element | Symbol | Purpose |
|---|---|---|
| Initial Node | ● (filled black circle) | Marks the start of the workflow. Only one per diagram. |
| Activity | Rounded rectangle | A high-level action or behavior (e.g., “Process Payment”). |
| Action | Small rounded rectangle or box | A specific task performed during the workflow (e.g., “Validate Credit Card”). |
| Control Flow | Solid arrow (→) | Shows sequence of execution from one action to another. |
| Object Flow | Dashed arrow (—→) or solid arrow with object notation | Represents the movement of data or objects (e.g., “Document”, “Invoice”) between actions. |
| Decision Node | ◊ (diamond) | A conditional branch (e.g., “Is payment approved?”). |
| Merge Node | ◊ (diamond) | Reunites multiple alternative flows into a single path. |
| Fork Node | Thick horizontal/vertical bar ( | |
| Join Node | Thick bar ( | |
| Activity Final Node | ⬤ (bullseye: circle with filled inner circle) | Terminates all flows in the diagram. Only one per diagram. |
| Object Node | Rectangle with dashed border or label | Represents an object involved in the flow (e.g., “Order”, “User Profile”). |
| Swimlane / Partition | Vertical or horizontal lane | Groups actions by actor, role, thread, or responsibility (e.g., Employee, Finance, System). |
📌 Pro Tip: Use swimlanes to clarify ownership and accountability—especially useful in multi-department or multi-role workflows.
Step-by-Step Process to Create an Effective Activity Diagram
While activity diagrams can be complex, following a structured approach ensures clarity, accuracy, and alignment with business or technical goals.
Step 1: Define the Scope
-
Clearly define the purpose of the diagram: Is it for a use case? A business process? An operation?
-
Example: “Model the workflow for processing a customer order in an e-commerce system.”
Step 2: List Activities and Actions
-
Break the process into discrete, atomic actions.
-
Start from the initial node and list each step in logical order.
-
Example:
-
Receive order
-
Check inventory
-
Validate customer details
-
Process payment
-
Fork: Ship & Bill in parallel
-
Step 3: Add Control and Object Flows
-
Connect actions with solid arrows for control flow.
-
Use dashed arrows to show object/data flow (e.g., “Order”, “Payment Receipt”).
-
Label flows where necessary (e.g., “if valid”, “if low stock”).
Step 4: Incorporate Decision Points
-
Insert diamonds for conditional logic.
-
Label each outgoing arrow with the condition (e.g., “Payment approved? → Yes/No”).
-
Ensure all paths are accounted for (e.g., yes/no, or multiple branches).
Step 5: Model Concurrency with Forks and Joins
-
Use fork nodes to split a flow into parallel tracks (e.g., billing and shipping).
-
Use join nodes to reunite them after completion.
-
Ensure every fork has a corresponding join to avoid deadlocks.
Step 6: Add Swimlanes (Optional but Recommended)
-
Divide the diagram into vertical or horizontal lanes to assign actions to actors or roles.
-
Example:
-
Lane 1: Customer
-
Lane 2: Order Processing System
-
Lane 3: Finance Department
-
Lane 4: Logistics Team
-
Step 7: Validate and Refine
-
Check for:
-
Missing join nodes (common pitfall).
-
Unbalanced forks/joins.
-
Dead-end paths or unreachable nodes.
-
Overly complex branching (consider simplifying with sub-diagrams).
-
-
Ensure one initial node and one final node (unless multiple ends are intentional).
Step 8: Use Tools to Automate Layout and Validation
-
Tools like Visual Paradigm offer auto-layout, error detection, and real-time validation.
-
Avoid manual alignment issues—let the tool optimize the diagram automatically.
Practical Examples: From Theory to Real-World Application
Let’s explore real-world scenarios to illustrate how activity diagrams capture complex workflows.
1. Word Processor Workflow (Linear Flow with Conditions)
Goal: Model the lifecycle of creating and saving a document.
Flow:
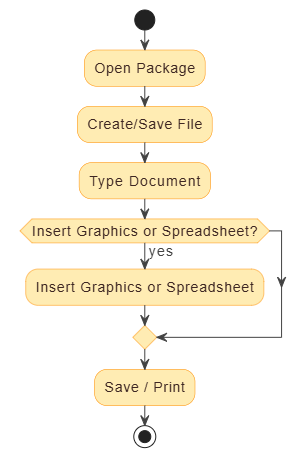
[Initial] → Open Package → Create/Save File → Type Document
               ↓
        [Optional: Insert Graphics or Spreadsheet?]
               ↓
           Save / Print → [Final]
-
Decision Node: “Insert additional content?”
-
Object Flow: “Document”, “Image File”, “Spreadsheet”
-
Use Case: Simple workflow with optional steps.
2. Process Order (Parallelism + Conditional Logic)
Goal: Model order processing with concurrent billing and shipping.
Flow:
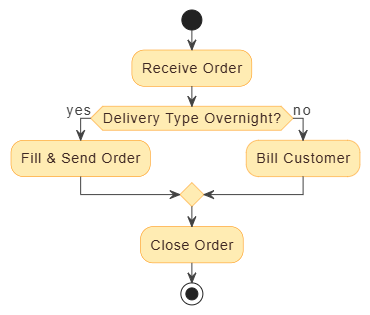
[Initial] → Receive Order
               ↓
         [Decision: Delivery Type?]
           /             \
     Overnight         Regular
       ↓                 ↓
   [Fork]            [Fork]
     ↓                 ↓
  Fill & Send Order   Bill Customer
     ↓                 ↓
   [Join]            [Join]
     ↓
   Close Order → [Final]
-
Fork/Join: Enables parallel processing of shipping and billing.
-
Swimlane Example: Assign “Fill & Send” to Logistics, “Bill” to Finance.
-
Key Insight: Demonstrates how activity diagrams manage concurrency and synchronization.
3. Student Enrollment (Linear with Decision)
Goal: Capture the enrollment process for university applicants.
Flow:
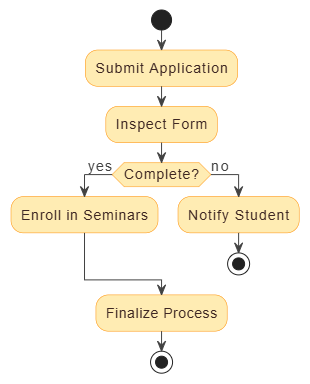
[Initial] → Submit Application
               ↓
        [Registrar: Inspect Form]
               ↓
       [Decision: Complete?]
        /             \
    Yes             No
     ↓               ↓
Enroll in Seminars   Notify Student → [Final]
-
Merge Node: Reunites both paths after feedback.
-
Swimlane: “Registrar”, “Student”, “Academic Office”
-
Use Case: Ideal for modeling conditional workflows with clear responsibilities.
4. Staff Expense Submission (Swimlane-Driven)
Vertical Swimlanes:
-
Employee: Submit Expense Report → Attach Receipts
-
Manager: Review → Approve/Reject
-
Finance: Process Payment → Update Records
Flow:
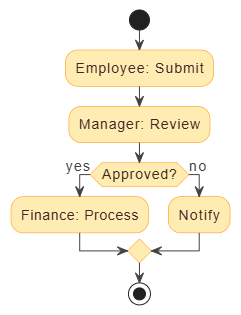
[Initial] → Employee: Submit → Manager: Review → [Decision: Approved?]
                         ↓               ↓
                      [Yes]           [No]
                         ↓               ↓
                   Finance: Process     Notify → [Final]
✅ Benefit: Clear separation of duties and accountability.
5. Meeting New Client (With vs Without Swimlanes)
-
Without Swimlanes: Hard to track who does what.
-
With Swimlanes: Clearly shows:
-
Sales: Prepare Proposal
-
Legal: Draft Contract
-
Finance: Review Budget
-
All: Review Meeting Minutes
-
🎯 Takeaway: Swimlanes dramatically improve readability and traceability in complex, multi-stakeholder processes.
Benefits and Best Practices
✅ Key Benefits of Activity Diagrams
-
Visual Clarity: Complex workflows become easy to understand.
-
Improved Communication: Bridges gaps between technical and non-technical teams.
-
Bottleneck Detection: Helps identify delays or redundant steps.
-
Traceability: Links directly to use cases, requirements, and operations.
-
Reusability: Can be embedded in documentation, reports, or code comments.
🛠️ Best Practices
-
Start Simple: Begin with a high-level view, then drill down into details.
-
Limit Swimlanes: Avoid more than 5–6 lanes; otherwise, the diagram becomes cluttered.
-
Use Clear Labels: Name actions precisely (e.g., “Validate Payment” vs “Do something”).
-
Avoid Overuse of Forks: Only use concurrency when truly needed (e.g., parallel tasks).
-
Ensure Every Fork Has a Join: Prevents unbalanced or infinite flows.
-
Use Sub-Processes for Complexity: Break large diagrams into sub-diagrams or call activities.
-
Keep It Readable: Use consistent layout (top-down or left-to-right), and avoid crossing arrows.
⚠️ Common Pitfalls to Avoid
-
Missing join nodes → leads to deadlocks or invalid models.
-
Too many decision nodes → increases complexity and reduces readability.
-
Ignoring object flows → misses critical data dependencies.
-
Overusing swimlanes → can make diagrams hard to follow.
How Visual Paradigm’s AI Ecosystem Revolutionizes Activity Diagram Creation
Traditional activity diagram creation is often tedious, error-prone, and requires deep UML expertise. Enter Visual Paradigm—a next-generation visual modeling platform that integrates AI, automation, and collaboration to transform the entire modeling lifecycle.

🔧 Key Features of Visual Paradigm’s AI Ecosystem
| Feature | How It Helps |
|---|---|
| AI Chatbot (Text-to-Diagram) | Describe a workflow in plain English: “Create an activity diagram for processing a customer order with parallel billing and shipping, including overnight delivery decision.” → Instantly generates a full UML-compliant diagram. |
| AI-Powered Use Case to Activity Diagram Generator | Automatically maps use cases into detailed activity diagrams. Ensures traceability and consistency across models. |
| Guided Web Apps (Step-by-Step Wizards) | Walks users through diagram creation with real-time validation. Prevents common errors like unbalanced forks or missing joins. |
| VP Desktop (Advanced Editing) | Full-featured desktop editor with auto-layout, code generation, export to PDF, HTML, and even reverse engineering from code. |
| OpenDocs (Dynamic Document Embedding) | Embed live, editable activity diagrams into wikis, Confluence, Notion, or knowledge bases. Changes update automatically across all documents. |
| AI Refinement Tools | Suggests improvements: “Add a merge node here”, “Consider splitting this into a sub-diagram”, “Optimize layout for readability”. |
🚀 Why This Changes Everything
| Traditional Approach | Visual Paradigm + AI |
|---|---|
| Manual drawing | Instant AI generation |
| Prone to errors (missing joins, bad flow) | AI enforces UML rules |
| Static image → hard to update | Live, editable diagrams |
| Isolated from documentation | Embedded in OpenDocs |
| Time-consuming (hours) | Done in minutes |
🎯 Result: Turn a conceptual idea into a production-ready, collaborative, and traceable model in under 10 minutes.
Real-World Impact: From Idea to Implementation
Imagine a product team designing a new e-commerce checkout flow:
-
Idea Phase: “We need to model the checkout process with multiple delivery options and parallel payment processing.”
-
AI Prompt: “Generate an activity diagram for a checkout process with options for standard, express, and overnight shipping. Include parallel processing of payment and order confirmation. Add swimlanes for Customer, System, and Payment Gateway.”
-
Result: A fully formed, UML-compliant diagram with forks, joins, swimlanes, and object flows—ready for review.
-
Refinement: “Add a merge node after payment confirmation” → AI updates the diagram instantly.
-
Documentation: Embed the diagram in a Confluence page with OpenDocs. Any changes are reflected live.
-
Development: Use the diagram to guide implementation, ensuring alignment with business logic.
Conclusion: Elevate Your Modeling with Intelligence, Not Just Diagrams
UML activity diagrams are not just about drawing boxes and arrows—they are strategic tools for understanding, communicating, and optimizing complex workflows. Whether you’re modeling a simple student enrollment or a multi-actor enterprise order process, activity diagrams provide the clarity and precision needed for success.
With Visual Paradigm’s AI-powered ecosystem, you’re no longer limited by manual drawing or guesswork. You gain:
-
Speed: From idea to diagram in minutes.
-
Accuracy: AI enforces UML standards and detects errors.
-
Collaboration: Real-time editing and live documentation.
-
Scalability: Full support for UML, SysML, C4, ArchiMate, and more.
🌟 Final Thought: Stop modeling by hand. Start modeling with intelligence.
Get Started Today
Experience the future of visual modeling with Visual Paradigm’s Free Community Edition or request a free trial to unlock full AI-powered features.
🔗 Visit Visual Paradigm – Start Modeling with AI
📌 Pro Tip: Try the AI Chatbot with prompts like:
“Create an activity diagram for a loan approval process with credit check, document verification, and manager review.”
“Convert this use case into an activity diagram with swimlanes.”
Transform your workflow from a chore into a strategic advantage—powered by AI, built on UML, and ready for implementation.
Here are 10 articles and resources regarding AI-powered activity diagram generation and modeling, written in English and formatted in Markdown:
- Mastering UML Activity Diagrams with AI | Visual Paradigm Blog: This article explores how AI-powered features enhance the creation and optimization of UML activity diagrams for developers and analysts.
- Integrating AI Activity Diagrams into Your Visual Paradigm Workflow: A technical guide explaining how to use AI modeling software to generate and refine activity diagrams using natural language.
- Generate Activity Diagrams from Use Cases Instantly with AI: This resource highlights how an AI engine enables the rapid conversion of use case descriptions into professional activity diagrams.
- Convert Use Case to Activity Diagram – AI-Powered Transformation: This page details a tool that automatically converts use case diagrams into detailed activity diagrams to visualize system workflows.
- AI-Powered Use Case to Activity Diagram Tutorial: A step-by-step guide demonstrating how AI features can automatically transform use case descriptions into detailed activity diagrams.
- Convert Use Case Diagrams to Activity Diagrams with Visual Paradigm: This resource explains the process of using intelligent modeling features to transform use case diagrams into activity diagrams automatically.
- Interactive UML Activity Diagram Creator – AI Chat Interface: An interactive tool that allows users to generate and edit UML activity diagrams in real time through an AI-powered chat interface.
- Comprehensive Guide: Transforming Use Cases into UML Activity Diagrams with AI: A detailed walkthrough on using AI-powered tools to automate the transition from use cases to structured activity diagrams.
- AI-Powered Editor for Converting Use Cases to Activity Diagrams: This online editor uses AI to provide intelligent suggestions while transforming use cases into structured UML activity diagrams.
- Interaction Overview vs. Interaction vs. Activity Diagram in UML: A comparative guide that explains the differences and specific use cases for activity diagrams compared to other UML interaction models.