


Introduction: The Era of Comprehensive Visual Modeling
The landscape of software and enterprise modeling has shifted. Gone are the days when a skilled architect needed days to manually wireframe a complex system or a student struggled to explain an idea without drawing tools. Today, Artificial Intelligence acts as a true Co-Pilot, accelerating the transition from abstract thought to professional artifact.
Visual Paradigm stands at the forefront of this revolution with its unique “Four Pillars” AI Ecosystem. Unlike competitors that offer only simple chat-to-diagram tools or rigid desktop generators, Visual Paradigm provides a holistic environment where AI blends seamlessly with professional modeling standards.

This tutorial will guide you through these four pillars, explaining their distinct roles, demonstrating how to use them, and sharing practical experiences on how to leverage this ecosystem for maximum efficiency.
Pillar 1: VP Desktop (Visual Model) – The Precision Engine
Who is it for? Professional developers, system architects, and experienced UML/SysML designers who need deep control, traceability, and version control over complex models.

The Experience
Imagine sitting down in the evening to finalize your System Architecture. You don’t just want a picture; you need a rigorous, coded-ready model that can be version-controlled and exported to code. That is the world of VP Desktop.
Here, AI is not a replacement for your skills; it is an accelerator.
-
The Workflow: You have a Jira backlog or a requirement document ready. Instead of building the diagram from scratch, you invoke the “AI-Powered” generators.
-
The Magic: Visual Paradigm’s AI has been trained on thousands of professional diagrams. It doesn’t just guess; it follows strict standards (like UML 2.5 or SysML).
-
Traceability: Crucially, every AI-generated element in Desktop is traceable. If a generated Class Diagram seems wrong, you can click the link inside the node to see the original Natural Language Requirement (NLR) or code snippet that created it. This ensures your model is always grounded in business logic.
Practical Tutorial: Generating a Complex SysML Model
-
Open VP Desktop. Load or create a new
sysml_modelfile. -
Use the Generators: Navigate to the
AI Generatormenu. Select “SysML Requirement Diagram Generator”. -
Input Context: Paste your natural language requirements (e.g., “The system shall support authentication via OAuth2 using JWT tokens and encrypt all database connections using AES-256”).
-
Refine: The AI instantly creates the requirement nodes. If the AI fails to capture a nuance, you edit the text. The model updates automatically.
-
Deep Link to Blocks: Select the requirements and use the “Link to Block Definition” feature to automatically generate the
Block Definition Diagram(BDD) containing the data types (e.g.,JwtToken,EncryptionKey). -
Result: You have a fully traceable, compliant SysML model in minutes, ready for engineering review.
Pro Tip: Always review AI-generated models for logical completeness. AI is great at syntax (drawing the right boxes), but you are the expert in semantics (ensuring the relationships make sense).
Pillar 2: OpenDocs – The Collaborative Canvas
Who is it for? Business analysts, product owners, and knowledge managers who need diagrams embedded directly into reports, wikis, and strategic documents.
The Experience
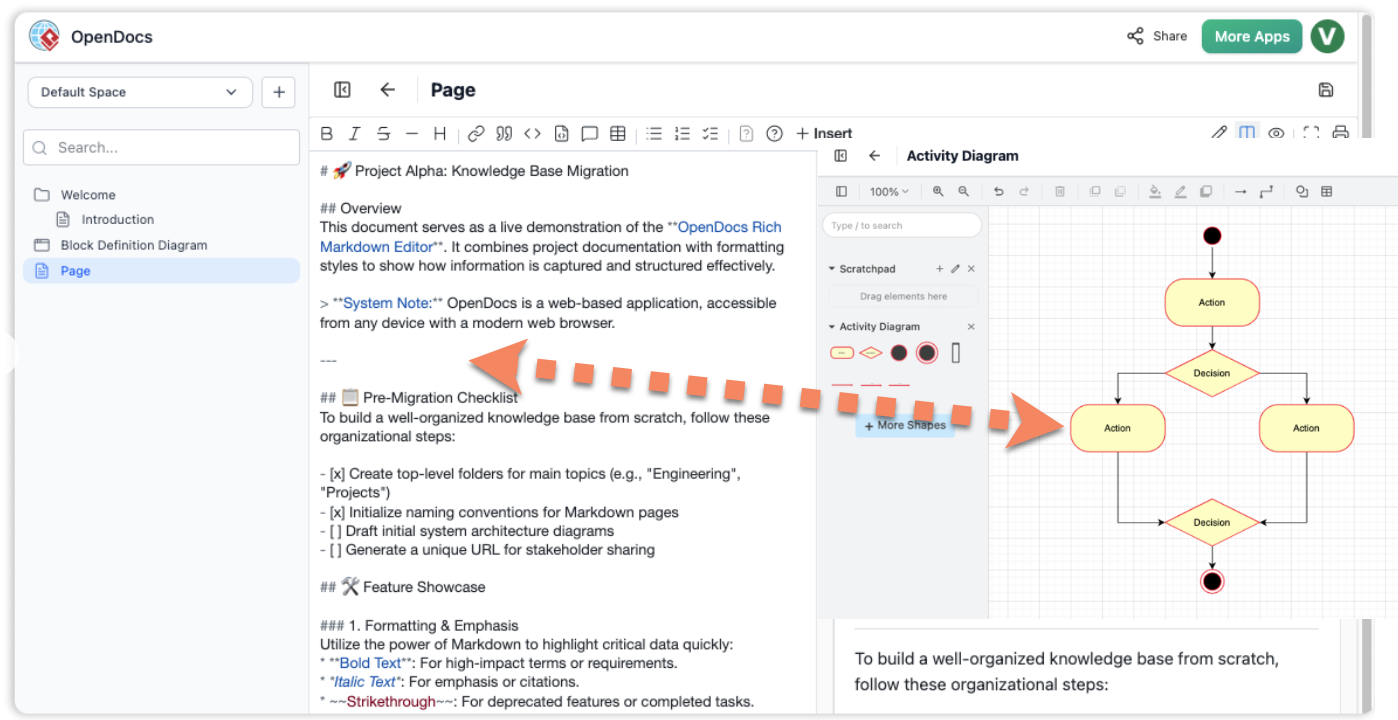
In many organizations, diagrams live in silos (e.g., in files that no one sees). OpenDocs breaks this silo. It functions like a super-powered Notion or Confluence but with a key difference: living diagrams.
When you use OpenDocs, you aren’t embedding an image (an SVG or PNG); you are embedding a live diagram object.
-
Live Editing: If the project changes, the diagram in the document updates.
-
Context: Diagrams appear exactly where the text describes them (e.g., right after a sentence about the “User Login Flow”).
-
Offline Capability: Since OpenDocs runs inside the VP Desktop engine, you can work offline and export to various formats later.
Practical Tutorial: Creating a Dynamic Strategy Document
-
Create an OpenDocs Page: Start a new page titled “Q4 Product Strategy.”
-
Drag and Drop: Type your strategy points. Drag an “Organization Chart” or a “Process Diagram” onto the text.
-
Edit Inline: Click the diagram. You can now drag elements, resize, and change colors directly on the page. No need to open a separate software.
-
Link Data: Connect the diagram elements to actual data sources or other pages in your documentation.
-
Collaborate: Share the link with your team. Another member can edit the flow, and everyone sees the update in real-time.
Pro Tip: Use OpenDocs for “Exploratory Modeling.” If you are brainstorming and don’t know the final structure, draw it quickly in OpenDocs. Once the structure is solid, you can export the specific diagrams to VP Desktop for rigorous engineering.
Pillar 3: AI Visual Modeling Chatbot – The Brainstorming Partner
Who is it for? Novice users, agile teams, and anyone stuck on a “blank canvas.” This is your conversational friend.
The Experience
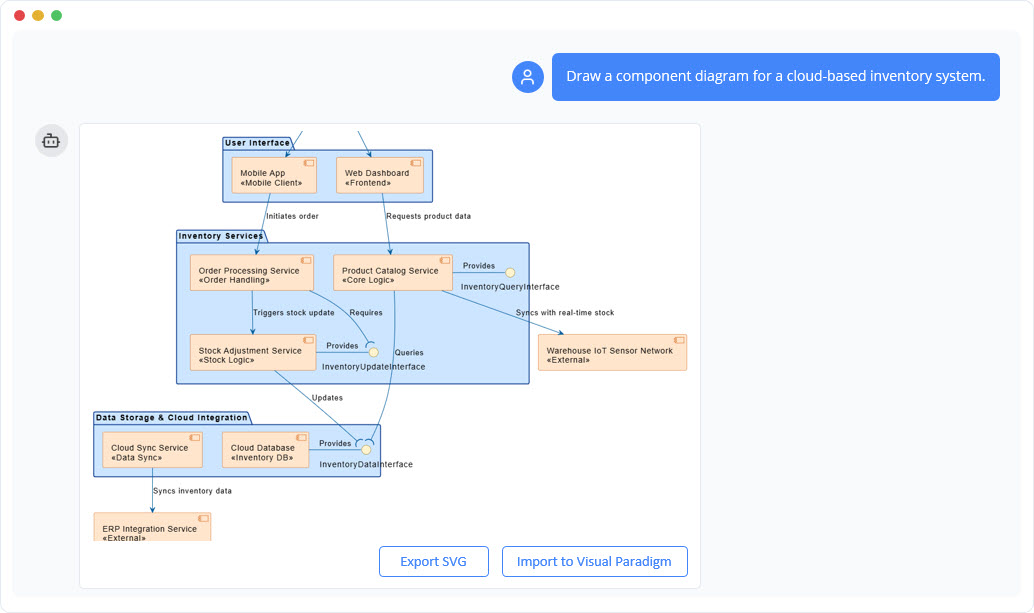
The biggest barrier to modeling is often starting. The Chatbot removes the friction. You speak naturally, and it translates your intent into a professional diagram.
-
Interactive Dialogue: You can say, “Make this diagram more detailed,” or “Convert this use case to a sequence diagram.”
-
Instant Conversion: It bridges gaps instantly. Want to see how a “Use Case” translates to a “State Machine”? Just ask.
-
Learning Resource: For beginners, this is the best way to learn modeling concepts. The chatbot explains why it placed a node where it did.
Practical Tutorial: Iterative Design
-
Start Chat: Open the Visual Model Co-Pilot.
-
First Pass: Type: “Create a Use Case diagram for a banking withdrawal system.”
-
Refinement: Review the output. Say: “The ‘Check Balance’ use case is missing the actor ‘Administrator’. Please add it and connect it with a <> stereotype.”
-
Conversion: Say: “Now, create a Sequence Diagram showing the interaction for the ‘Withdraw Money’ use case, assuming the UI sends a request to the API first.”
-
Visual Tweaks: Use the chat to adjust formatting instantly. “Use a dark blue theme and orient the actors on the left.”
Pro Tip: Use the Chatbot for “Proof of Concept” modeling before building the real model. It allows you to iterate on ideas cheaply and quickly without setting up a complex desktop environment.
Pillar 4: Web Apps & Guided Tools – The Specialized Studios
Who is it for? Enterprise teams needing strict adherence to specific methodologies (C4, ArchiMate, SWOT) without installing heavy desktop suites or managing complex versions.
The Experience
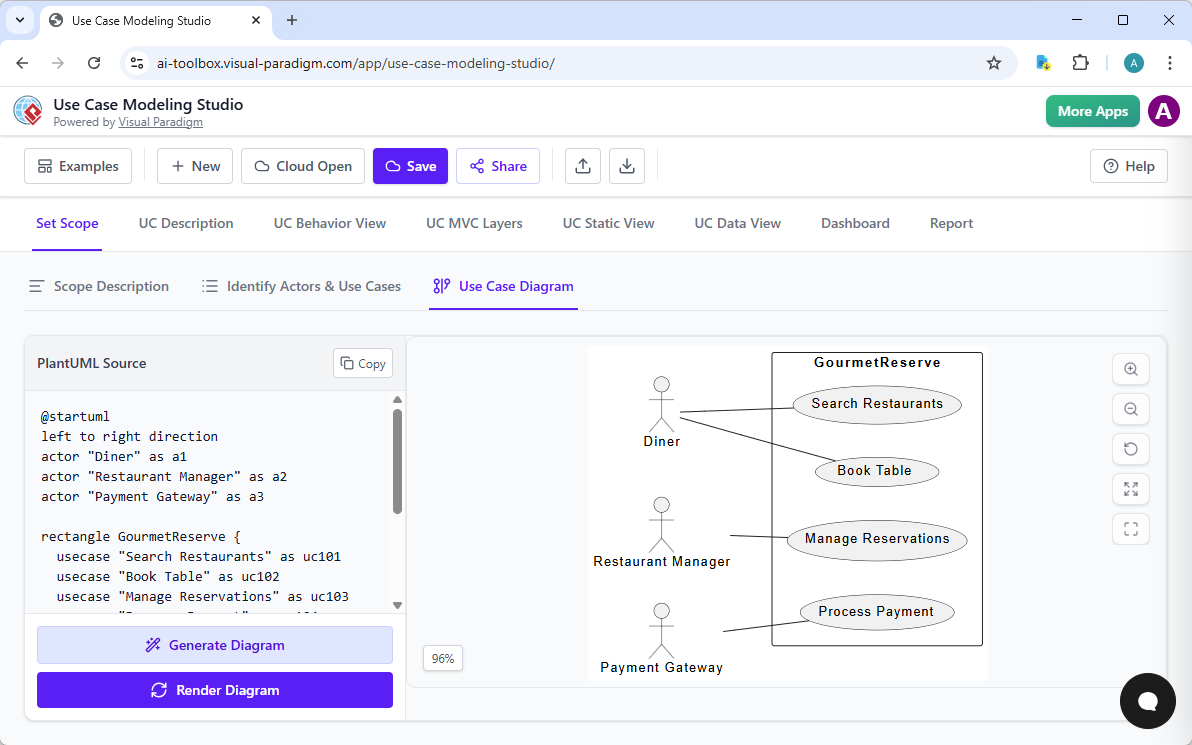
These are browser-based, guided workflows. They are “fill-in-the-blank” wizards powered by AI, ensuring you don’t miss steps.
-
C4 PlantUML Studio: The gold standard for C4 modeling. It forces you to define System Context, then Containers, then Components, then Systems. You cannot jump ahead. This ensures architectural consistency.
-
Infographic Designers: Dedicated tools for generating specific infographic types (SWOT, PESTLE, RACI) where the AI populates the quadrants based on your inputs.
-
Accessibility: These run in the browser. You can share them with non-technical stakeholders who simply need to input text and get a chart.
Practical Tutorial: Building a C4 Architecture
-
Launch Studio: Go to the C4 PlantUML Studio.
-
Level 1 (Context): Describe your system (e.g., “Payment Gateway”). Describe the users (“Customers”, “Merchants”). The AI generates the Context Diagram.
-
Level 2 (Container): Provide details on your tech stack (“React Frontend”, “AWS S3”, “Kubernetes Cluster”). The AI generates the Container Diagram, linking it to the previous model.
-
Level 3 (Component): Describe internal logic (“Transaction Processor”, “Encryption Service”).
-
Export: Generate
.pngor print the diagram. Because it was built step-by-step, the navigation from Context -> Container -> Component is automatically established.
Pro Tip: Use this for presentations. Since the diagrams are generated from structured text, you can regenerate them later if the requirements change, ensuring your presentation is always up to date.
Comparative Analysis: Choosing the Right Tool for the Job
To effectively use the Visual Paradigm ecosystem, you must know which pillar to apply when. Here is a summary of the decision matrix:
| Scenario | Best Pillar | Why? |
|---|---|---|
| I need to build code or perform rigorous engineering review. | VP Desktop | Full traceability, version control, syntax precision, and artifact export. |
| I am writing a report and need a diagram to illustrate a paragraph. | OpenDocs | Embedded, live editing, seamless text-diagram flow. |
| I don’t know how to draw this yet; I need help starting. | AI Chatbot | Natural language interaction, low barrier to entry, immediate feedback. |
| I need a specific methodology (C4, ArchiMate) for compliance/standards. | Web Apps / Guided Tools | Step-by-step enforcement prevents modeling errors; easy for non-experts to use. |
| I am doing a quick swap (e.g., Use Case $\to$ Sequence). | AI Chatbot | Fastest conversion time via dialogue. |
Supported Diagrams Across the Pillars
Visual Paradigm currently supports a vast range of diagram types across these four pillars.
1. UML Diagrams
-
Class, Object, Component, Deployment, Use Case, Sequence, Activity, State Machine, Communication, Timing, Package
-
Desktop: Full Support (Generation, Editing, Traceability).
-
Chatbot: Strong support for generation and refinement.
-
OpenDocs: Casual, editable embeds for Class, Object, etc.
-
Web Apps: Available via AI-Powered Generators (e.g., Use Case Studio).
-
2. SysML (Systems Engineering)
-
Requirement, Internal Block, Block Definition, Parametric
-
Desktop: Full reactive modeling support.
-
Web Apps: C4 and SysML guided studios ensure proper linking.
-
3. Enterprise & Strategic Analysis
-
ArchiMate, C4, SWOT, PESTLE, Strategy Matrices (BCG, Ansoff)
-
Desktop: Deep ArchiMate modeling with 26+ viewpoints.
-
Web Apps: Specialized Infographic Designers for SWOT, PESTLE, BCG, etc.
-
Chatbot: Can generate outline versions of strategic models.
-
4. General & Data Visualization
-
Flowcharts, Mind Maps, Org Charts, Process Maps, ERDs
-
Desktop: Professional layout control.
-
Web Apps: Templates for quick generation.
-
Chatbot: “Draw me a flowchart for X” works exceptionally well here.
-
Real-World Use Case: A Unified Platform Approach
Let’s walk through a complete project lifecycle using the 4 Pillars together. This demonstrates how they complement rather than compete.
Phase 1: Discovery (Using the Watris/Tutor persona)
-
Goal: Understand the business problem.
-
Tool: AI Chatbot.
-
Action: “Act as a senior analyst. I need to build a new order processing system. Create a high-level Use Case diagram and a Brainstorming Mind Map to identify key features.”
-
Outcome: You have a high-level scope and feature list. The Chatbot has generated the initial nodes.
Phase 2: Strategic Planning (Using OpenDocs)
-
Goal: Align stakeholders and document the strategy.
-
Tool: OpenDocs.
-
Action: Create a document. Drag the generated Mind Map and the initial Use Case diagram into the text. Add sections on “Market Analysis” using a SWOT Infographic Generator (Web App) directly into the page.
-
Outcome: A single, living document where the strategy, market analysis, and initial scope are visually connected.
Phase 3: Detailed Design (Using VP Desktop)
-
Goal: Define the technical architecture and database.
-
Tool: VP Desktop.
-
Action:
-
Use the AI Use Case Modeling Studio (Web App) to generate a detailed Use Case diagram based on the brainstorming. Import it into Desktop.
-
Use the AI Class Diagram Generator to create the domain model from the “Features” list.
-
Use AI Traceability to link the Database Entities (ERD) to the Class Diagram attributes.
-
Create the C4 Component diagram for the deployment.
-
-
Outcome: A full suite of diagrams with traceable links back to the original business requirements.
Phase 4: Communication (Back to OpenDocs & Web Apps)
-
Goal: Present the design to the team.
-
Tool: OpenDocs again.
-
Action: Embed the finalized Desktop diagrams into the project wiki. Use the 5-Aspects Infographic Designer to create a “Key Takeaways” summary for management.
-
Outcome: Stakeholders see the final architecture and key highlights in a digestible format.
Conclusion: Why Visual Paradigm Wins
The beauty of the Visual Paradigm ecosystem is integration.
-
In other tools, your Chatbot diagram is a static image. In Visual Paradigm, it’s a live object.
-
In other tools, your SysML model is hard to link to requirements. In Visual Paradigm, every generated block is linked via traceability.
-
In other tools, you must choose one area of expertise. In Visual Paradigm, you have AI tools for Software, Systems, Enterprise Architecture, Strategy, and Data—all working together.
By utilizing the Four Pillars:
-
Desktop for engineering precision.
-
OpenDocs for collaborative documentation.
-
Chatbot for rapid ideation and learning.
-
Web Apps for specialized, guided compliant work.
You achieve what no single tool alone can: A complete, traceable, and dynamically updated visual model of your entire organization or software system.
Start by trying the AI Chatbot today to overcome your next “blank canvas” moment, then move to OpenDocs to share your ideas, and reserve VP Desktop for when you need to build the solid foundation your codebase will stand upon. The future of modeling is here, and it is visual.
Resource
- Harnessing Visual Paradigm’s AI for Diagram Generation: The Ultimate 2026 Guide: A comprehensive forward-looking guide analyzing how Visual Paradigm has evolved in 2026, focusing on the integration of AI with enterprise-grade structure, traceability, and collaboration features to streamline diagram generation.
- Comprehensive Guide to Visual Paradigm’s AI-Powered UML and Modeling Ecosystem: An in-depth overview of the full AI-powered ecosystem for UML and modeling, covering the landscape from 2025 through 2026 to provide users with a complete understanding of available tools and workflows.
- Introduction to Visual Paradigm: An official documentation introduction providing a brief description of Visual Paradigm’s core purpose, licensing options, and the key features that define its support for visualization and modeling.
- AI Chatbot: The official product page detailing the Visual Paradigm AI Chatbot feature, highlighting its capabilities in generating diagrams via natural language processing, refining designs through conversation, and serving as an intelligent assistant within the platform.
- Case Study: Enhancing System Modeling Efficiency with Visual Paradigm’s AI-Powered Chatbot: A practical case study demonstrating real-world efficiencies gained by implementing the AI-powered chatbot for system modeling, focusing on time savings, accuracy improvements, and workflow automation.
- Comprehensive Guide to Use Case Modeling with Visual Paradigm’s AI Ecosystem: A tactical guide specifically focused on Use Case modeling, detailing how Visual Paradigm’s AI ecosystem can be leveraged to generate, refine, and analyze use case diagrams effectively.
- Comprehensive Guide to Use Case Modeling with Visual Paradigm’s AI Ecosystem (Part 2): The second part of the use case modeling guide, likely covering advanced techniques, deeper analysis of relationships, and extended workflows within the AI ecosystem.
- Visual Paradigm 18.0 Release: AI-Powered Features: An official release announcement detailing the specific AI-powered features introduced in version 18.0 of Visual Paradigm, including new generative capabilities and enhancements to existing tools.
- AI Markmap Studio: The Comprehensive Guide to Automated Mind Mapping: A specialized guide focused on the Markmap Studio feature, explaining how AI acts as a “co-pilot” to transform vague ideas into structured mind maps automatically.
- YouTube: Visual Paradigm’s AI Cloud Architecture Studio: A video tutorial demonstrating the Visual Paradigm AI Cloud Architecture Studio, walking viewers through the process of generating cloud architecture diagrams, refining designs, and exporting reports.