


Creating a customer journey map is a common practice for modern businesses. However, many organizations produce visual diagrams that look impressive in a presentation but fail to generate tangible revenue. The gap between a theoretical map and an operational tool is where value is lost. To bridge this divide, you must design journey maps with a specific focus on sales outcomes. This means moving beyond simple satisfaction metrics and digging into the friction points that stop a prospect from closing. This guide provides a detailed, actionable framework for constructing customer experience maps that align marketing efforts with sales goals.
A robust journey map is not just a diagram; it is a strategic document that informs decision-making across departments. It reveals where customers feel uncertain, where they need more information, and how your team can intervene effectively. By understanding the emotional and logical progression of a buyer, you can optimize touchpoints to increase conversion rates. This approach requires discipline, data, and a willingness to challenge assumptions about how your product is perceived.
Why Most Maps Fail to Drive Revenue 📉
It is common to see teams invest weeks into creating a visual representation of the customer path. Yet, months later, sales figures remain stagnant. The root cause often lies in the intent behind the mapping exercise. If the goal is merely to visualize the process, the result is a static artifact. To drive sales, the map must be dynamic and integrated into daily operations. Below are the primary reasons why journey maps do not lead to growth:
Departmental Silos: Marketing creates the map without input from Sales or Customer Support. This leads to a disconnect between what is promised and what is delivered.
Lack of Specificity: Generic stages like “Awareness” or “Decision” are too broad to guide specific actions. You need to know exactly what the customer is doing at hour one versus week four.
Ignoring Emotion: Rational data points are tracked, but the emotional state of the buyer is ignored. Fear, doubt, and excitement drive decisions more than features.
Static Documentation: The map is created once and filed away. Customer behaviors change, and the map must evolve to reflect market shifts.
No Accountability: There is no owner assigned to fix the friction points identified in the map. Issues are noted but never resolved.
When you address these failures, you shift the map from a passive illustration to an active engine for revenue generation. This requires a shift in mindset from viewing the map as a marketing deliverable to treating it as a sales enablement tool.
The Core Anatomy of a Sales-Driven Map 🧬
To build a map that works, you must understand its fundamental components. A sales-focused journey map differs slightly from a general experience map. While the latter focuses on satisfaction, the former focuses on progression toward a transaction. Each element must be designed to reduce friction and increase confidence.
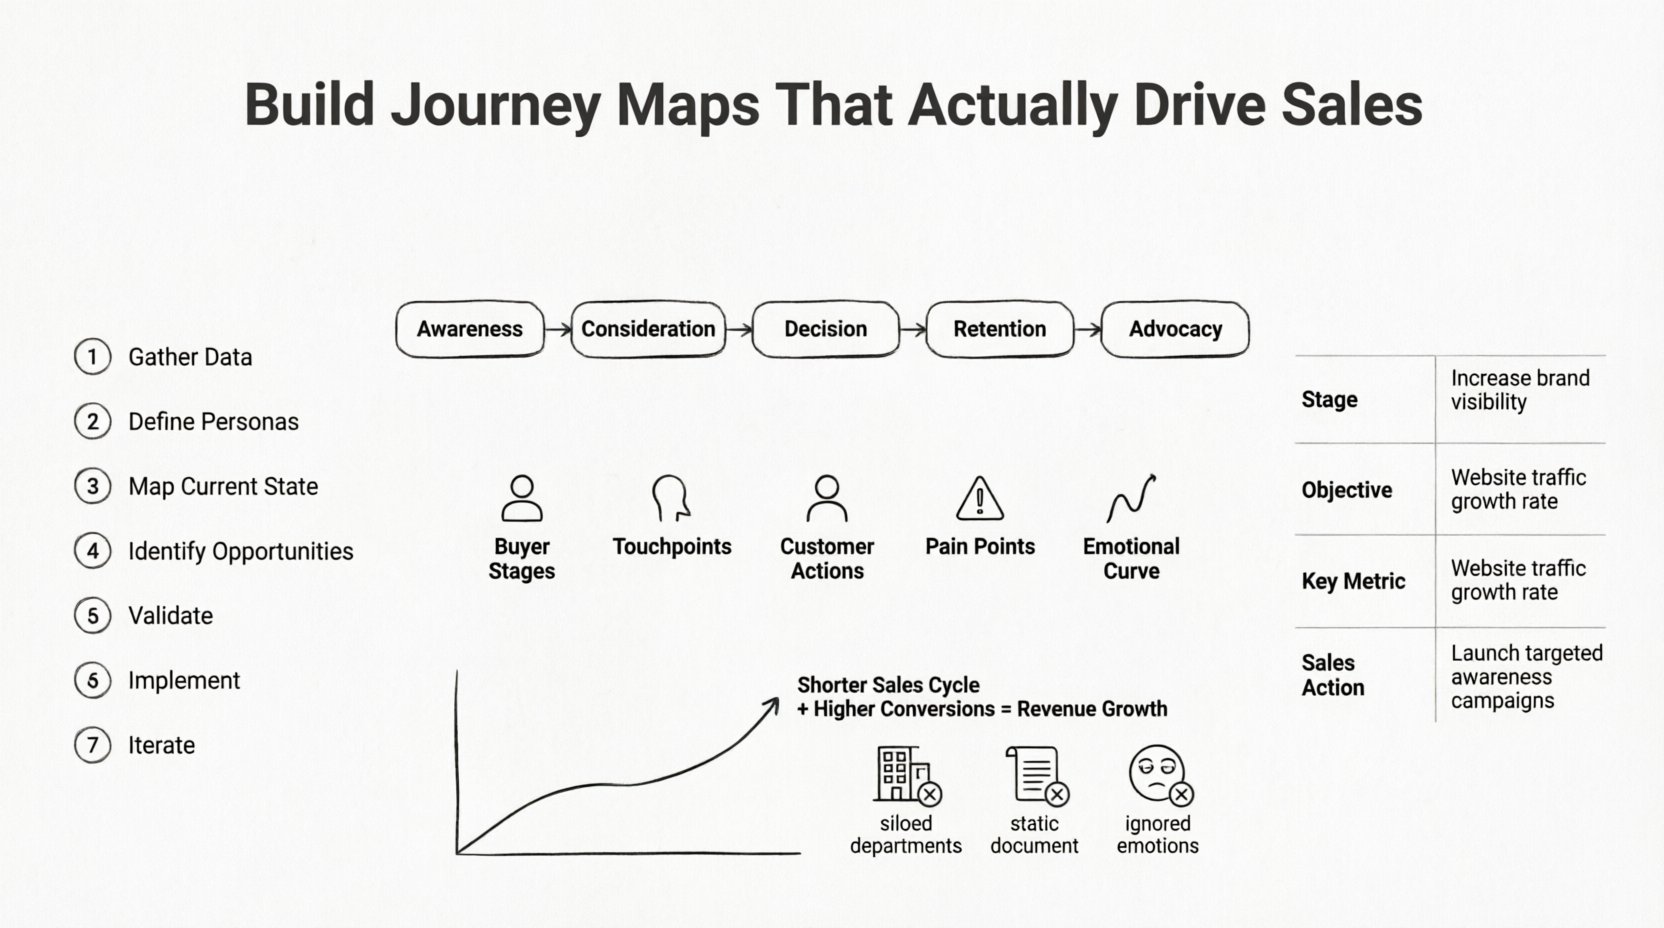
1. The Buyer Stages
Instead of standard industry terms, define stages based on the buyer’s intent. For example, rather than “Consideration,” use “Evaluating Solutions.” This shift in language forces your team to think about the specific psychological hurdles the buyer faces at that moment. The stages should reflect the decision-making process, not just the marketing funnel.
2. The Touchpoints
A touchpoint is any interaction a customer has with your brand. In a sales context, this includes emails, demos, pricing pages, and support calls. You must catalog every single point of contact. Missing a touchpoint creates a blind spot where a prospect can fall through the cracks. Ensure you identify both digital and physical interactions.
3. The Customer Actions
What is the user actually doing? Are they reading a case study? Are they comparing prices? Are they hesitating before clicking “Buy Now”? Documenting these micro-actions helps you identify where the sales team can provide assistance. For instance, if a customer spends a long time on the pricing page, it signals a need for clearer value justification.
4. The Pain Points
This is the most critical section for driving sales. A pain point is any obstacle that prevents progress. It could be a confusing checkout process, a lack of trust in the brand, or a missing piece of information. Map these explicitly and link them to potential revenue loss. If a specific pain point causes 20% of drop-offs, fixing it should be the top priority.
5. The Emotional Curve
Track the emotional state of the customer at each stage. They might start with curiosity, move to skepticism, and end with relief. Understanding this curve allows you to tailor your communication. If the curve dips into anxiety during the decision phase, your sales scripts and materials must address those fears directly.
Step-by-Step Implementation Guide 🛠️
Building an effective map requires a structured approach. Follow these steps to ensure accuracy and alignment. Do not skip the research phase, as assumptions will lead to incorrect maps.
Step 1: Gather Data Sources
Collect data from multiple channels. Look at CRM records to see where deals stall. Analyze website heatmaps to see where users scroll. Conduct interviews with customers who churned and those who converted. You need both quantitative and qualitative data.Step 2: Define Target Personas
A map for a first-time buyer is different from a map for an enterprise client. Define who you are mapping for. Create profiles that include their role, goals, challenges, and buying authority. Ensure these personas reflect real data, not stereotypes.Step 3: Map the Current State
Document the process exactly as it happens now, not how you wish it happened. Include all delays, handoffs, and rework. This honest assessment is the baseline for improvement.Step 4: Identify Opportunities
Review the current state map for gaps. Where is information missing? Where is the wait time too long? Where is the language confusing? Brainstorm solutions that directly impact the bottom line.Step 5: Validate with Stakeholders
Review the map with sales representatives, support agents, and product managers. They know the reality of customer interactions better than anyone. Their feedback will correct blind spots.Step 6: Implement Changes
Turn the insights into action items. Update landing pages, train sales teams on new scripts, or automate specific follow-ups. Assign owners to each task.Step 7: Monitor and Iterate
Set a schedule to review the map quarterly. Customer behaviors change, and your map must evolve. Track the metrics you identified to see if the changes worked.
Aligning Touchpoints for Revenue Growth 💰
Once the map is built, the focus shifts to execution. Alignment across teams is crucial. If Marketing attracts a lead, but Sales does not follow up within the expected timeframe, the map breaks. Here is how to align specific touchpoints to ensure a smooth transition.
Marketing to Sales Handoff
This is a critical moment. The map should define the exact criteria for a lead to be passed to sales. Ensure the information gathered during the marketing stage is visible to the sales team immediately. A prospect who filled out a specific form should trigger a notification to a sales representative. This reduces latency and increases the chance of capture.
Sales to Onboarding Handoff
After the sale, the journey does not end. The onboarding phase is the first test of the promise made during the sale. If the onboarding experience is difficult, the customer will feel misled. The map should include the first 30 days of the customer lifecycle. Ensure sales tells onboarding exactly what the customer expects so they can deliver it.
Support Integration
Customer support interacts with the product daily. They hear the complaints that sales never sees. Integrate support feedback into the journey map. If customers are struggling with a specific feature, update the map to reflect this barrier. Sales can then be trained to manage expectations or product teams can prioritize fixes.
Measuring What Matters 📊
You cannot improve what you do not measure. When building a sales-focused map, you must define the key performance indicators (KPIs) that align with the map’s goals. Do not just track vanity metrics like page views. Focus on metrics that indicate movement through the journey.
Below is a table outlining the key metrics for each stage of the journey.
Stage | Objective | Key Metric | Sales Action |
|---|---|---|---|
Awareness | Generate Interest | Website Traffic / CTR | Identify high-intent leads from content consumption |
Consideration | Evaluate Solution | Time on Page / Demo Requests | Provide case studies and pricing guides |
Decision | Close Deal | Proposal Acceptance Rate | Address objections and finalize terms |
Retention | Ensure Success | Churn Rate / NPS | Check-in calls and upsell opportunities |
Advocacy | Drive Referrals | Referral Rate | Implement referral programs |
Using this table ensures that every stage has a clear success criterion. If the “Consideration” stage has low demo requests, you know where to intervene. If the “Decision” stage has low proposal acceptance, you know the value proposition is unclear. This data-driven approach prevents guesswork.
Common Mistakes to Watch Out For ⚠️
Even with a solid plan, errors can occur. Being aware of common pitfalls helps you avoid them. These mistakes can undermine the entire initiative and waste resources.
Assuming Knowledge: Do not assume your team knows how the customer thinks. What seems obvious to you might be confusing to a new prospect. Always verify with user testing.
Ignoring Negative Feedback: It is tempting to focus on happy customers. However, unhappy customers reveal the most about where the process fails. Analyze churn reasons deeply.
Overcomplicating the Map: A map with 50 touchpoints is unusable. Focus on the critical path that leads to purchase. Simplify the visual representation to keep it readable.
Lack of Visibility: If the map is only in a PDF file, no one will use it. Host it on a shared drive where the entire team can access and edit it in real time.
One Size Fits All: Do not create a single map for all customers. A small business buyer has a different journey than a large enterprise. Create segments if necessary.
Data Sources for Accuracy 📝
To ensure the map is based on reality, you need reliable data sources. Relying on memory or internal opinions leads to bias. Here are the best sources to consult.
CRM Data: Look at the deal history. Where do deals typically stall? How long does the sales cycle last? This provides a timeline of the actual buying process.
Customer Interviews: Speak to recent buyers. Ask them to walk you through their thought process. “What was the biggest hurdle you faced before buying?”
Surveys: Send post-interaction surveys. Ask customers to rate their experience at specific points. This provides quantitative sentiment data.
Support Tickets: Review the most common support issues. These often highlight gaps in the product or documentation that affect the sales cycle.
Analytics: Use web analytics to see drop-off points. If 50% of users leave the pricing page, there is a specific friction point there.
Combining these sources creates a holistic view. It validates the emotional data with behavioral data. This triangulation ensures the map is accurate and actionable.
Integrating Feedback Loops 🔁
A journey map is a living document. It requires a mechanism for continuous feedback. Without this, the map becomes outdated within months. Establish a process for updating the map based on new information.
Create a feedback channel where team members can flag issues. If a salesperson notices a new objection during calls, they should be able to log it. If a customer complains about a specific feature, product managers should be alerted. This feedback should be reviewed during monthly strategy meetings. Updates to the map should be version-controlled so everyone knows the current state.
The Impact on Revenue 📈
When executed correctly, journey mapping has a direct impact on the bottom line. By removing friction, you shorten the sales cycle. By addressing pain points, you increase conversion rates. By aligning teams, you improve customer retention.
Consider the cumulative effect of small improvements. If you reduce the time to close by one week across 100 deals per year, you free up capacity for new business. If you increase the conversion rate by 5%, you generate significant additional revenue without increasing ad spend. These gains compound over time. The journey map is the blueprint for achieving these efficiencies.
Final Thoughts on Execution ✅
Building a journey map that drives sales is a marathon, not a sprint. It requires commitment from leadership and collaboration across departments. Do not expect immediate results from the first draft. Use the map as a tool for experimentation. Test changes, measure the outcome, and adjust the map accordingly.
Focus on the customer. Keep coming back to the question: “Does this change make the customer’s life easier?” If the answer is yes, it will likely help your sales. If the answer is no, remove it. By keeping the customer at the center of the map, you ensure that your revenue goals are sustainable and ethical. This approach builds trust, which is the foundation of long-term growth.
Start small. Pick one persona and one stage of the journey. Map it in detail. Fix the friction points. Measure the results. Then expand to the next segment. This iterative method reduces risk and builds confidence in the process. Over time, the entire organization will adopt a customer-centric mindset, leading to consistent performance improvements.