


Every business faces a persistent challenge: customers start the journey but do not finish it. Whether it is an abandoned shopping cart, a trial account that never converts, or a support ticket that goes unanswered, these drop-off points represent lost revenue and damaged brand perception. To address this, organizations must look beyond surface-level metrics and examine the underlying customer journey mapping process.
Identifying exactly where customers disengage is not about guessing. It requires a systematic approach to data collection, behavioral analysis, and experience optimization. This guide details how to locate friction within the customer lifecycle, understand the root causes of attrition, and implement structural changes to retain users.
🧭 Understanding Customer Drop-off Points
A drop-off point is any stage in the user experience where the number of participants decreases significantly compared to the previous step. In conversion terms, this is often called a churn point or a friction point. These moments are critical because they indicate a breakdown in trust, usability, or value proposition.
Customers do not leave randomly. Their exit is usually the result of specific triggers. Recognizing these triggers allows teams to intervene before the relationship ends. Key characteristics of drop-off points include:
- Sudden Declines in Volume: A sharp decrease in users moving from one page to another.
- High Exit Rates: Specific pages where users consistently terminate the session.
- Time Spent: Users lingering too long on a single field or page, indicating confusion.
- Feedback Signals: Direct complaints or low satisfaction scores at specific touchpoints.
Mapping these points transforms raw data into actionable insights. Instead of viewing a drop-off as a failure, view it as a signal that the current path does not align with user expectations.
📊 The Anatomy of a Leaky Journey
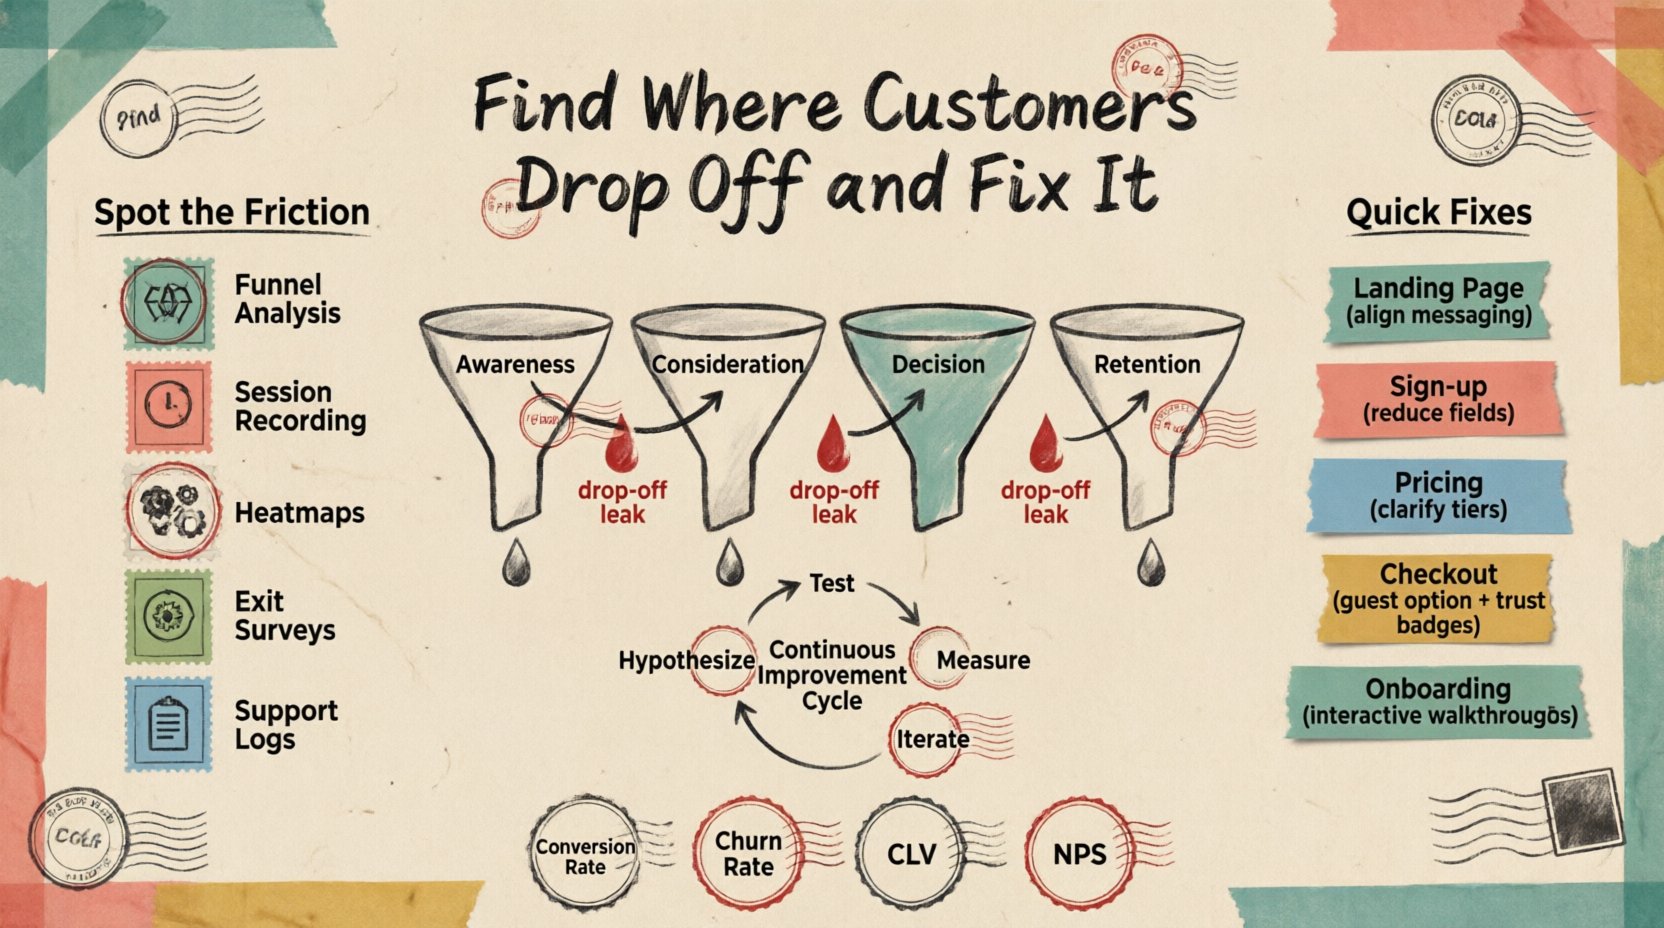
To fix the leaks, you must first map the water flow. A standard customer journey typically follows a linear progression, though modern paths are often non-linear. Understanding the distinct stages helps isolate where the drop-off occurs.
1. Awareness and Acquisition
Users arrive via search, social media, or referrals. Drop-off here often stems from mismatched expectations. If the landing page promise does not match the ad click, users bounce immediately.
2. Consideration and Engagement
Users are evaluating the offering. Friction in this stage often relates to complexity. If the information architecture is confusing, or if pricing is hidden, users will withdraw interest.
3. Decision and Conversion
This is the critical moment of commitment. Common drop-offs occur due to friction in the checkout or sign-up process. Mandatory fields, lack of payment options, or security concerns can halt progress.
4. Retention and Advocacy
Even after conversion, users can leave. Post-purchase onboarding, lack of support, or failure to deliver promised value leads to churn. This stage is often overlooked but is vital for long-term viability.
🔍 Methods to Identify Friction
Locating the precise moment of disengagement requires a mix of quantitative and qualitative data. Relying on a single data source can lead to incorrect assumptions. A robust strategy combines analytics with direct user feedback.
- Funnel Analysis: Track the percentage of users who complete each step of a defined process. A steep drop between Step A and Step B indicates a barrier at Step B.
- Session Recording: Reviewing how users navigate the interface reveals hesitation. Watch for rapid clicking, backtracking, or rage-clicking on non-clickable elements.
- Heatmaps: Visual representations of clicks and scroll depth show where attention is lost. If users do not scroll past a fold, key content is invisible.
- Exit Surveys: Ask users why they are leaving at the moment of exit. Direct questions yield direct answers regarding barriers.
- Support Logs: Analyze tickets and calls. Recurring questions often point to confusing UI elements or missing information.
When analyzing data, look for patterns. A single user leaving is noise; a pattern of 500 users leaving at the same point is a signal. Quantitative data tells you where, while qualitative data explains why.
🛠️ Strategic Fixes for Common Stages
Once the friction points are identified, teams must prioritize fixes based on impact and effort. Not every drop-off needs immediate attention. Focus on high-value stages that affect the most revenue or retention.
Fixing Acquisition Drop-offs
Ensure messaging consistency. The language on the landing page must match the ad or social post. Simplify the initial call to action. If the goal is a demo request, make the form short. Reduce cognitive load by removing distractions from the page.
Fixing Consideration Friction
Improve content clarity. Use plain language instead of jargon. Provide comparison guides or FAQs to answer objections before they arise. Ensure mobile responsiveness, as many users research on handheld devices.
Fixing Conversion Barriers
Streamline the checkout process. Offer guest checkout options. Display trust signals like security badges prominently. Auto-fill address fields where possible. Ensure error messages are helpful, telling users exactly how to correct a mistake rather than just saying “Error”.
Fixing Retention Issues
Enhance onboarding. Guide new users through the core value of the product. Send proactive check-in emails. Create a knowledge base that is easy to search. Address bugs and performance issues quickly, as technical failures erode trust rapidly.
Common Friction Points vs. Solutions
| Stage | Symptom | Actionable Solution |
|---|---|---|
| Landing Page | High Bounce Rate | Align headline with ad copy; remove pop-ups on entry. |
| Sign-up Form | Abandonment | Reduce field count; enable social login; show progress bar. |
| Pricing Page | Low Click-Through | Clarify tier differences; add ROI calculator; show case studies. |
| Checkout | Cart Abandonment | Offer multiple payment gateways; display total cost upfront. |
| Onboarding | Feature Ignorance | Implement interactive walkthroughs; send tip-based emails. |
🔄 Continuous Improvement Cycles
Fixing drop-offs is not a one-time project. User behavior evolves, and what works today may fail tomorrow. Establish a cycle of testing, learning, and iterating.
- Define Hypotheses: Before making changes, state why you believe a fix will work. For example, “Removing the ‘Name’ field will increase sign-ups by 10%.”
- Implement Changes: Roll out the modification to a segment of users.
- A/B Testing: Compare the modified version against the original to measure impact statistically.
- Monitor Metrics: Watch for unintended consequences. A fix might improve conversion but lower quality of leads.
- Document Results: Keep a record of what worked and what failed to build institutional knowledge.
Continuous improvement requires a culture that values data over opinion. Decisions should be driven by evidence gathered from the journey mapping process.
🤝 Cross-Functional Alignment
Journey mapping often silos within departments, but the customer experience is holistic. Marketing, sales, product, and support teams must align to fix drop-offs effectively.
- Marketing: Provides data on acquisition channels and ensures messaging consistency.
- Product: Owns the usability and functionality of the platform.
- Support: Knows the pain points users face after purchase.
- Management: Allocates resources to fix high-priority friction points.
Regular cross-functional meetings help share insights. Support tickets might reveal a bug that marketing is unaware of. Product updates might explain why sales conversion dropped. Shared visibility ensures that fixes address the whole journey, not just one department’s silo.
📈 Measuring the Impact
After implementing fixes, you must measure success to justify the investment. Use key performance indicators that reflect the health of the journey.
- Conversion Rate: The percentage of users who complete the desired action.
- Churn Rate: The percentage of users who stop using the service over a period.
- Customer Lifetime Value (CLV): The total revenue expected from a single customer account.
- Net Promoter Score (NPS): A measure of user satisfaction and loyalty.
- Task Success Rate: The ability of users to complete specific tasks without assistance.
Set baselines before making changes. If the conversion rate was 2%, aim for a realistic improvement, such as 2.5%. Small, consistent gains compound over time to create significant revenue growth.
🚀 Next Steps for Your Team
Start by auditing your current data. Do you have the tools to track user flow? If not, implement basic tracking to understand the baseline. Next, map the current journey visually. Get the team together to draw the path customers take.
Identify the top three drop-off points. These are the most critical areas to address. Gather feedback from users in those specific areas. Finally, create a plan to test solutions. Remember, the goal is not perfection, but continuous progress.
By systematically finding where customers drop off and fixing it, businesses can transform leaks into growth opportunities. The journey never truly ends, but with the right approach, every step forward builds a stronger foundation for the future.