


In the modern digital landscape, understanding how customers interact with your brand is no longer optional; it is fundamental. Customer journey optimization relies heavily on accurate information. Without solid data, strategies are based on assumptions rather than reality. This guide explores how to leverage information effectively to refine touchpoints, reduce friction, and enhance the overall experience. We will move beyond intuition and establish a framework for decision-making that is rooted in evidence.
🧠 The Foundation of Data-Driven Strategy
Data-driven decision-making involves collecting, analyzing, and interpreting information to guide business actions. In the context of customer journeys, this means understanding every interaction a user has with your organization. It is not enough to know that a sale occurred; you must understand the path taken to reach that point. This approach minimizes risk and maximizes the return on investment for optimization efforts.
There are two primary categories of data you must consider:
- Quantitative Data: This includes measurable numbers such as click-through rates, bounce rates, time on page, and conversion percentages. It answers the question of what is happening.
- Qualitative Data: This includes feedback from surveys, user interviews, session recordings, and support tickets. It answers the question of why it is happening.
Combining these two types provides a holistic view. Numbers tell you where the drop-off is, while feedback explains the reason behind the abandonment. Relying solely on one type can lead to incomplete insights and suboptimal changes.
🔍 Mapping the Journey with Precision
Before optimizing, you must map the current state. A journey map visualizes the process a customer goes through to achieve a goal with your brand. This could be purchasing a product, signing up for a newsletter, or resolving a support issue. When building this map, you need to integrate data at every stage.
Key Stages of the Journey
Most journeys follow a general progression, though the specific touchpoints vary. Here is a breakdown of common stages and the data points relevant to each:
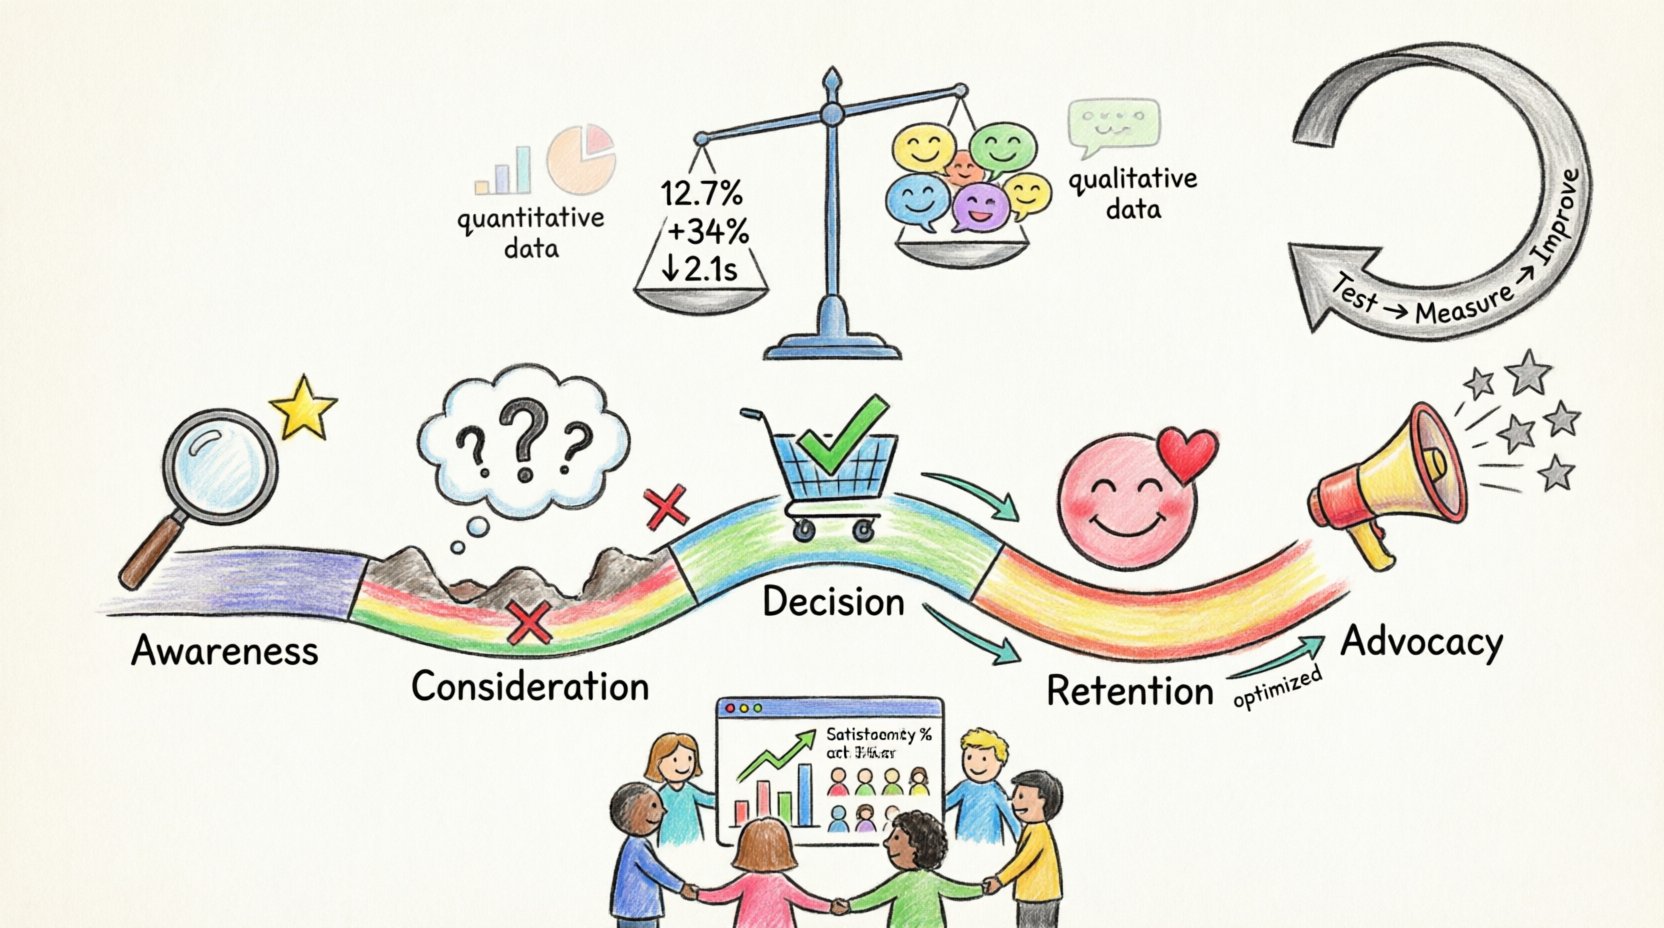
- Awareness: How do they find you? Track source channels (organic search, social media, paid ads) and initial engagement metrics.
- Consideration: How do they evaluate you? Monitor time spent on comparison pages, content downloads, and email open rates.
- Decision: How do they buy? Analyze cart abandonment rates, checkout completion time, and payment method preferences.
- Retention: Do they come back? Look at repeat purchase rates, churn rates, and customer lifetime value.
- Advocacy: Do they recommend you? Measure Net Promoter Score (NPS), referral traffic, and social shares.
By assigning specific metrics to each stage, you create a baseline. This baseline allows you to identify where the journey is performing well and where it requires intervention.
📉 Identifying Friction Points
Friction is anything that hinders a customer from completing their goal. It creates friction in the flow, causing frustration or confusion. Identifying these points is critical for optimization. Data helps you pinpoint exactly where these bottlenecks exist.
Common indicators of friction include:
- High Exit Rates: If a significant number of users leave a specific page, investigate the content or layout immediately.
- Form Abandonment: If users start filling out a form but do not finish, the fields may be too complex or confusing.
- Low Engagement: If users scroll past key information without interacting, the value proposition may not be clear.
- Slow Load Times: Technical performance directly impacts user patience. Slow pages increase bounce rates significantly.
Below is a table outlining common friction indicators and the corresponding data signals you should look for:
| Friction Indicator | Data Signal | Potential Cause |
|---|---|---|
| Page Abandonment | High Bounce Rate < 10 seconds | Misleading title or slow load speed |
| Cart Drop-off | High Add-to-Cart, Low Checkout Start | Unexpected shipping costs or forced account creation |
| Support Overload | Spike in Tickets for Specific Feature | Confusing User Interface or Lack of Instructions |
| Search Failure | Zero Result Pages | Poor Search Algorithm or Inventory Gaps |
🛠️ Collecting Data Without Bias
To make valid decisions, the data collection process must be robust and unbiased. Relying on a single source or a specific segment can skew your understanding. You need a comprehensive approach to gathering information.
Methods of Data Collection
- Analytics Platforms: Use standard tracking tools to monitor user behavior across devices and browsers. Ensure cross-domain tracking is enabled to follow users seamlessly.
- Surveys and Feedback Forms: Deploy these at strategic moments, such as after a purchase or support interaction. Keep questions short to improve response rates.
- Session Recordings: Watch how users interact with the interface. This reveals confusion that analytics metrics might miss, such as rage clicking or hesitation.
- Heatmaps: Visual representations of where users click and scroll. This highlights which areas attract attention and which are ignored.
It is crucial to respect user privacy and comply with regulations. Transparency builds trust. When users know their data is being used to improve their experience, they are more likely to engage.
🔄 The Optimization Loop
Optimization is not a one-time event; it is a continuous cycle. You implement changes based on data, measure the results, and refine further. This loop ensures that your strategy evolves with customer needs.
Steps in the Optimization Loop
- Formulate a Hypothesis: Based on data, propose a change. For example, “If we simplify the checkout form, conversion will increase.”
- Design the Test: Create variations of the element you want to change. Ensure only one variable is altered at a time to isolate the impact.
- Run the Experiment: Split traffic between the control and the variation. Use statistical significance to ensure results are not due to chance.
- Analyze Results: Review the data to see if the hypothesis was correct. Look for both positive and negative impacts on other metrics.
- Implement or Iterate: If successful, roll out the change. If not, analyze why and formulate a new hypothesis.
This structured approach prevents random changes that might harm the user experience. Every adjustment should be backed by evidence.
🤝 Aligning Teams for Success
Data-driven decisions require collaboration across departments. Marketing, sales, product, and support all interact with the customer journey. Silos can lead to conflicting data and disjointed experiences.
Consider the following alignment strategies:
- Shared Dashboards: Create a central location where key journey metrics are visible to all stakeholders. This ensures everyone is working from the same facts.
- Regular Review Meetings: Schedule periodic sessions to discuss journey performance. Focus on trends rather than daily fluctuations.
- Customer-Centric Language: Ensure all teams understand the journey stages. Avoid jargon that obscures the actual user experience.
- Feedback Integration: Allow support teams to input qualitative data directly into the analytics system. Frontline insights are often the most valuable.
When teams share a unified view of the data, they can prioritize initiatives that benefit the entire organization rather than individual goals.
📈 Measuring Impact and ROI
Optimization efforts must demonstrate value. You need to track key performance indicators that reflect business goals. While user experience is important, it must ultimately support business viability.
Important metrics to track include:
- Conversion Rate: The percentage of users who complete a desired action.
- Average Order Value: The average amount spent per transaction.
- Customer Acquisition Cost: The cost to acquire a new customer through specific channels.
- Customer Lifetime Value: The total revenue expected from a single customer account.
- Task Success Rate: The percentage of users who successfully complete a specific task.
When presenting these metrics to stakeholders, focus on the narrative. Explain how a specific change in the journey led to a specific improvement in the metric. This connects the technical work to the bottom line.
⚖️ Qualitative vs. Quantitative Balance
While numbers are powerful, they do not tell the whole story. A high drop-off rate tells you something is wrong, but it does not tell you if it is the price, the design, or the loading speed. Qualitative data fills this gap.
Integrating qualitative insights involves:
- Direct User Interviews: Speak to customers who have recently completed or abandoned the journey.
- Usability Testing: Observe users attempting to complete tasks in a controlled environment.
- Customer Feedback: Analyze reviews and social media mentions for sentiment.
- Sales Call Recordings: Listen to calls where customers express hesitation or objections.
When quantitative and qualitative data align, your confidence in decision-making increases significantly. When they conflict, investigate further to understand the discrepancy.
🌐 Cross-Channel Consistency
Customers interact with brands across multiple devices and platforms. They might see an ad on social media, visit the website on a desktop, and complete the purchase on a mobile app. Ensuring data consistency across these channels is vital.
Challenges in cross-channel data include:
- Identity Resolution: Linking anonymous browsing sessions to identified user profiles across devices.
- Attribution Modeling: Determining which touchpoint deserves credit for the conversion.
- Data Latency: Ensuring data is available in real-time or near real-time for decision-making.
A unified data strategy ensures that the customer feels a single brand, regardless of the channel. This consistency builds trust and reduces confusion during the journey.
🛡️ Data Privacy and Ethics
As you collect more data, the responsibility to protect it grows. Ethical data usage is a requirement for maintaining customer trust. Breaches or misuse of data can damage reputation irreparably.
Best practices for ethical data handling include:
- Minimization: Only collect data that is necessary for the journey optimization.
- Consent: Ensure users explicitly agree to data collection through clear opt-in mechanisms.
- Security: Implement robust security measures to protect stored information.
- Transparency: Clearly communicate how data is used in privacy policies.
Respecting privacy is not just a legal obligation; it is a competitive advantage. Customers are more likely to engage with brands they trust to handle their information responsibly.
🚀 Future-Proofing Your Approach
The landscape of data and technology is constantly evolving. New methods of collection and analysis emerge regularly. Staying adaptable is key to long-term success.
Consider these emerging trends:
- Artificial Intelligence: AI can analyze vast datasets to find patterns humans might miss.
- Predictive Analytics: Forecasting future behavior based on historical data allows for proactive optimization.
- Privacy-First Tracking: As third-party cookies phase out, focus on first-party data strategies.
- Real-Time Personalization: Delivering content based on immediate user actions rather than historical profiles.
Investing in a flexible infrastructure allows you to adopt new tools and methods as they become available without disrupting existing operations.
📝 Summary of Actionable Steps
To summarize the path toward data-driven journey optimization, follow this checklist:
- Define clear goals for the customer journey.
- Establish a baseline using current performance data.
- Map all touchpoints and assign relevant metrics to each.
- Collect both quantitative and qualitative data.
- Identify friction points using exit rates and feedback.
- Formulate hypotheses based on data insights.
- Test changes through controlled experiments.
- Measure impact against key performance indicators.
- Share findings across departments for alignment.
- Continuously iterate based on new data.
By following these steps, you create a resilient framework for improvement. You move from guessing to knowing, ensuring that every change contributes to a better experience and stronger business outcomes.
💡 Final Thoughts on Journey Intelligence
Data is the compass that guides journey optimization. It removes guesswork and replaces it with clarity. However, data is a tool, not a strategy in itself. It must be applied with empathy for the user. The goal is not just to extract more value, but to provide more value to the customer.
When you prioritize data-driven decisions, you create a culture of continuous improvement. This culture responds quickly to changes in customer behavior and market conditions. It ensures that your organization remains relevant and competitive in a dynamic environment.
Start small. Pick one stage of the journey, gather the data, and make one informed change. Measure the result. Build on that success. Over time, these incremental improvements compound into a significantly optimized experience that drives growth and loyalty.