


Customer journey mapping is often treated as a static artifact, a diagram pinned to a wall to satisfy stakeholder requirements. However, the true power of a journey map lies in its predictive capability. When you modify a touchpoint or remove a friction barrier, you are fundamentally altering the probability of a user completing a desired action. Understanding how to predict conversion lift from map adjustments transforms mapping from a descriptive exercise into a strategic forecasting tool.
This guide details the methodology for estimating the financial impact of journey changes before a single line of code is written or a campaign is launched. By integrating behavioral data with structural analysis, teams can quantify the potential return on investment for UX and marketing initiatives.
Why Prediction Matters Before Execution 🧠
Resource allocation is finite. Marketing budgets, development sprints, and design hours are all limited. Without a clear projection of outcomes, teams often rely on intuition or “gut feeling” to prioritize which journey segments deserve attention. This approach leads to wasted effort on low-impact areas.
Predictive modeling offers a structured alternative. It allows stakeholders to:
- Compare scenarios: Weigh the potential gain of optimizing the checkout flow against improving the onboarding experience.
- Manage risk: Identify adjustments that might look beneficial but could actually introduce friction or confusion.
- Justify spend: Provide data-backed evidence for why a specific redesign is necessary to secure budget approval.
- Set realistic targets: Establish KPIs that are ambitious yet grounded in historical data.
When you adjust a journey map, you are essentially hypothesizing a change in user behavior. The goal is to validate that hypothesis with a mathematical framework before investing in the build.
Understanding the Baseline Conversion Rate 📊
Before estimating a lift, you must know the current state. The baseline conversion rate serves as the anchor for all calculations. In the context of customer journey mapping, this is not merely the overall site conversion rate, but the specific conversion rate associated with the segment being mapped.
Defining the Baseline
A baseline is specific to the journey stage and the device or channel used. A mobile user navigating a booking flow has a different baseline than a desktop user reading a whitepaper. To ensure accuracy, consider the following factors:
- Segmentation: Are you looking at new visitors, returning users, or a specific demographic?
- Timeframe: Use a rolling average (e.g., last 90 days) to smooth out anomalies like holidays or site outages.
- Attribution: Understand which touchpoint is credited for the conversion. If your map adjustment targets a middle-funnel touchpoint, the baseline must reflect the conversion path leading to that point.
Calculating the Baseline Formula
The foundation of the prediction is simple:
Baseline Conversion Rate = (Total Conversions / Total Sessions) × 100Once you have this percentage, you can apply it to traffic volume to determine the current revenue or lead volume. Any adjustment to the map aims to change this percentage.
Categorizing Map Adjustments 🛠️
Not all changes to a journey map are created equal. Some are cosmetic, while others are structural. To predict lift effectively, you must categorize the type of adjustment you are proposing. Different types of changes carry different levels of risk and potential reward.
| Adjustment Type | Description | Typical Impact Range |
|---|---|---|
| Friction Removal | Eliminating steps, simplifying forms, or fixing broken links. | High |
| Value Proposition Shift | Changing copy, imagery, or offers to better align with user intent. | Medium to High |
| Navigation Flow | Rearranging the sequence of pages or steps in a funnel. | Medium |
| Channel Integration | Connecting offline interactions with digital touchpoints (or vice versa). | Variable |
| Visual Hierarchy | Changing button colors, placement, or size. | Low to Medium |
When predicting lift, a friction removal strategy typically yields more predictable results than a visual hierarchy change. Friction removal addresses a known barrier, whereas visual changes rely on psychological assumptions that require more rigorous testing.
The Math Behind Conversion Lift Estimation ➗
Estimating conversion lift requires a multi-step calculation. It involves combining traffic data, baseline rates, and an estimated impact factor derived from the map adjustment.
Step 1: Traffic Volume Projection
Determine how many users will be exposed to the adjusted journey. This is often derived from historical traffic patterns for the specific channel or segment. For example, if you are optimizing the mobile checkout flow, use mobile traffic data specifically.
Step 2: Impact Factor Estimation
This is the most critical variable. It represents the percentage improvement you expect to see in the conversion rate. This factor is rarely a guess; it should be derived from:
- Historical Benchmarks: What has similar changes achieved in the past?
- Industry Standards: What is the average lift for this type of adjustment in your sector?
- Qualitative Feedback: If users repeatedly complain about a specific step, removing it might yield a significant jump.
Step 3: The Calculation
The formula for predicted lift is:
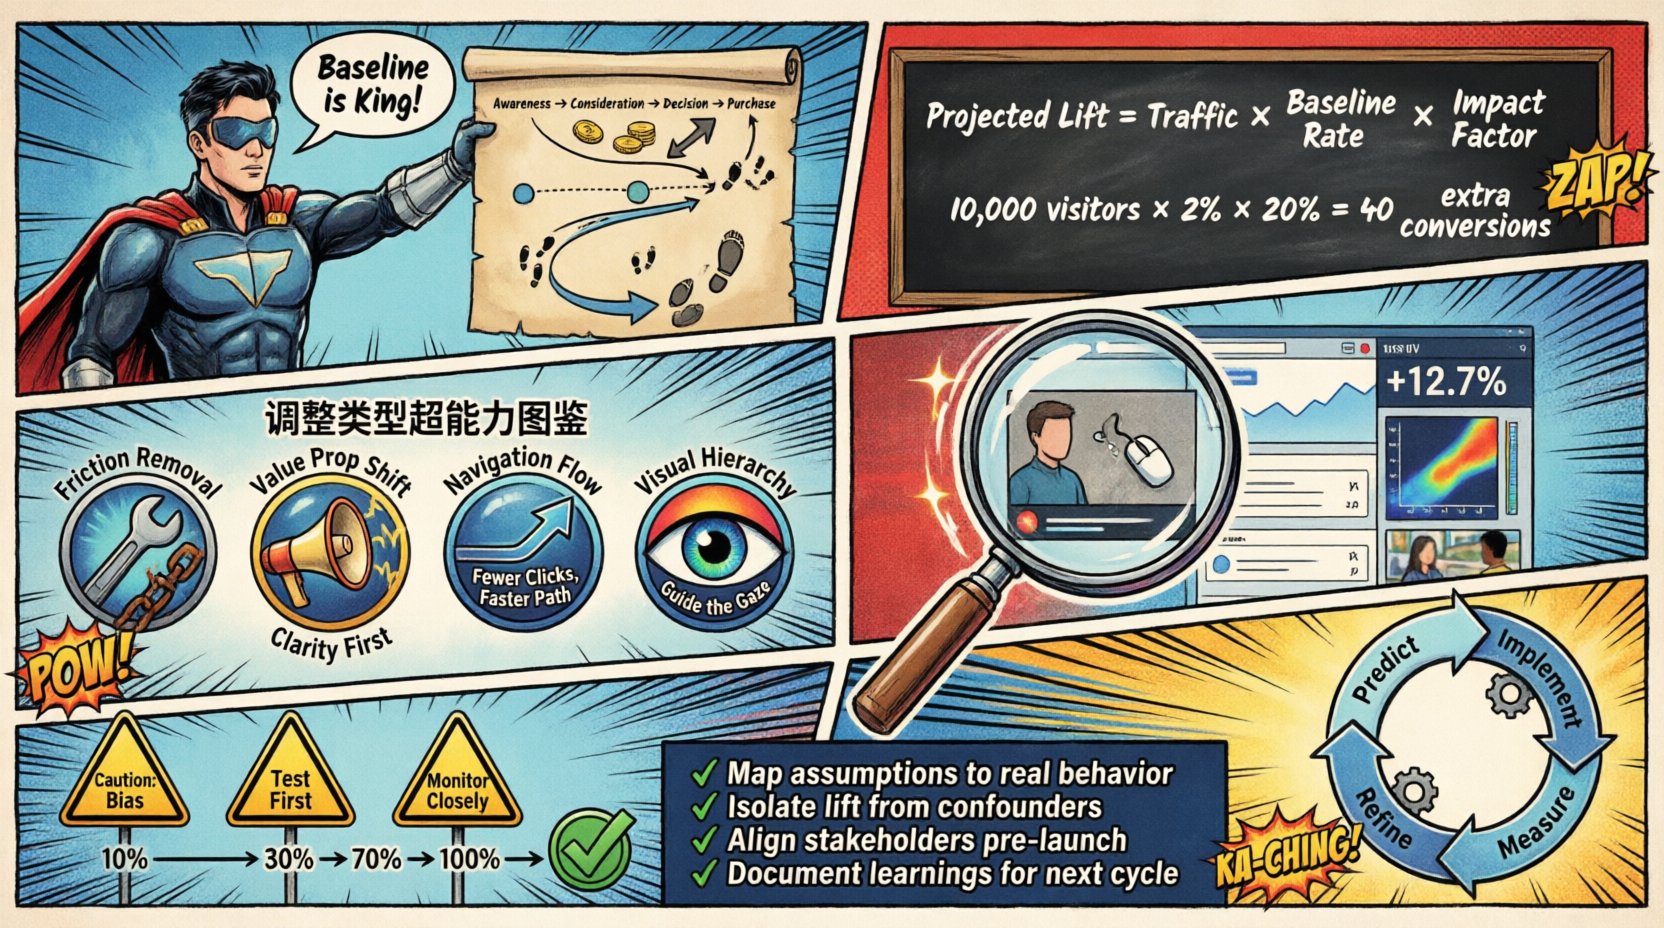
Projected Lift = Traffic × Baseline Rate × Impact FactorFor example, if you have 10,000 monthly visitors, a baseline conversion rate of 2%, and you predict a 20% relative improvement from a map adjustment:
- Current Conversions: 10,000 × 0.02 = 200
- New Conversion Rate: 2% + (2% × 20%) = 2.4%
- New Conversions: 10,000 × 0.024 = 240
- Lift: 40 additional conversions per month.
This simple math allows you to translate a UX change into a tangible business metric.
Integrating Qualitative Insights 🗣️
Numbers tell you what is happening, but qualitative data explains why. Relying solely on analytics can lead to misinterpretation of the journey map. To accurately predict lift, you must layer qualitative insights over the quantitative baseline.
Identifying Friction Points
Qualitative research helps pinpoint exactly where users drop off. If analytics show a 50% drop at a specific form, qualitative data tells you if it is because the field is confusing, the page loads slowly, or the user simply isn’t ready.
Methods to gather qualitative data:
- Session Recordings: Watch users struggle with specific elements.
- Usability Testing: Observe users attempting to complete the mapped journey in a controlled environment.
- User Interviews: Ask direct questions about their experience and motivations.
- Support Tickets: Analyze recurring complaints related to specific journey stages.
Scoring Friction Severity
Not all friction points are equal. To refine your prediction, assign a severity score to each identified barrier. A high-severity barrier (e.g., a broken payment gateway) offers a massive lift potential if fixed. A low-severity barrier (e.g., a slightly confusing label) offers minimal lift.
| Friction Severity | Definition | Estimated Impact on Lift |
|---|---|---|
| High | Blocks completion entirely (e.g., error, paywall). | Significant (10%+ lift) |
| Medium | Causes hesitation or confusion (e.g., unclear CTA). | Moderate (5-10% lift) |
| Low | Minor annoyance (e.g., long loading time, small font). | Minimal (<5% lift) |
By mapping these severity scores to the impact factor in your calculation, your prediction becomes more nuanced and accurate.
Data Sources for Accurate Forecasting 📈
Accurate prediction depends on the quality of the data feeding the model. In the absence of specific software tools, the focus must be on the data points themselves. Ensure you are aggregating data from diverse sources to create a holistic view of the journey.
1. Web Analytics
Standard traffic and conversion data are the backbone. Look for:
- Exit rates on specific pages.
- Time spent on page.
- Bounce rates for landing pages within the journey.
- Device and browser compatibility issues.
2. CRM Data
For B2B or high-value B2C scenarios, CRM data provides context on lead quality. It helps determine if a drop-off in the journey is due to poor fit or poor experience.
3. Heatmaps
Visual representations of user interaction highlight where users click and scroll. This helps verify if the map adjustment aligns with actual user behavior.
4. Survey Data
Direct feedback via on-page surveys or post-interaction emails provides sentiment data. Net Promoter Score (NPS) or Customer Satisfaction (CSAT) scores at specific journey stages can indicate where the map needs adjustment.
Risk Assessment in Journey Changes ⚠️
Every adjustment carries risk. Sometimes, changing a journey map can inadvertently decrease conversion. A thorough risk assessment is a necessary step in the prediction process.
Types of Risk
- Confusion Risk: Does the new flow deviate too much from user expectations?
- Performance Risk: Will the new design slow down page load times?
- Segment Risk: Does the change help one user group while hurting another?
- SEO Risk: Does the structural change impact crawlability or indexing?
Mitigation Strategies
To manage these risks, incorporate a safety margin into your prediction. If you predict a 10% lift, assume 5% in your planning to account for unforeseen negatives. Additionally, consider a phased rollout. Instead of changing the entire journey map at once, implement changes in stages to isolate variables.
Phased Implementation Plan:
- Phase 1: Test the change on a small segment (e.g., 10% of traffic).
- Phase 2: Analyze impact on conversion and engagement metrics.
- Phase 3: Roll out to 100% of traffic if metrics hold.
- Phase 4: Monitor long-term retention and satisfaction.
Validating Predictions Post-Implementation ✅
The cycle does not end at prediction. Validation is where the real learning happens. After implementing the map adjustments, compare the actual results against the projected lift.
Gap Analysis
Calculate the variance between predicted and actual performance. If your prediction was 20% lift but you achieved 10%, investigate why:
- Was the baseline incorrect?
- Was the impact factor overestimated?
- Did external factors (competitors, market shifts) interfere?
- Did the implementation introduce new bugs?
Updating the Model
Use this gap analysis to refine future predictions. If you consistently overestimate the impact of visual changes, adjust your internal benchmarks downward. This creates a feedback loop that improves the accuracy of your journey mapping over time.
Common Pitfalls to Avoid 🚫
Even with a solid framework, errors can occur. Being aware of common mistakes helps maintain the integrity of your predictions.
- Ignoring Device Differences: A journey that works on desktop might fail on mobile. Always segment by device.
- Confusing Correlation with Causation: Just because a conversion rate went up after a change doesn’t mean the change caused it. Seasonality or marketing campaigns could be the driver.
- Focusing on Vanity Metrics: Don’t optimize for clicks if the goal is sales. Ensure the conversion metric aligns with business goals.
- Over-Optimization: Removing every single friction point can sometimes reduce the perceived value of the offering. Users sometimes associate effort with quality.
- Static Mapping: Journeys are dynamic. A map from six months ago might not reflect current user behavior. Keep data fresh.
Future-Proofing Your Journey Strategy 🚀
As user behavior evolves, so must your mapping strategies. Emerging technologies and changing privacy regulations will impact how data is collected and how journeys are tracked. Preparing for these shifts ensures your predictive capabilities remain robust.
Key Trends to Watch
- Privacy-First Tracking: With restrictions on cookies and third-party data, first-party data collection becomes critical for accurate baselines.
- Personalization at Scale: Users expect unique journeys. Predictive models must account for dynamic content variations.
- Voice and Visual Search: These new entry points alter how users initiate journeys. Maps must include these non-textual touchpoints.
- Real-Time Analytics: The ability to react to journey changes instantly requires faster data processing.
Building a Culture of Measurement 📐
Ultimately, the ability to predict conversion lift from map adjustments relies on organizational culture. It requires collaboration between design, analytics, and marketing teams. Silos prevent the flow of information needed to build accurate models.
Collaboration Framework
Create a shared workspace where journey maps are living documents. Ensure that:
- Designers have access to conversion data to inform their choices.
- Marketers understand the technical constraints of the journey.
- Analysts have visibility into the qualitative research being conducted.
When teams share ownership of the journey, the quality of the map improves. Better maps lead to better predictions, which lead to better business outcomes.
Summary of Key Takeaways
- Baseline is King: Never estimate lift without a solid, segmented historical baseline.
- Categorize Changes: Understand the difference between friction removal and visual tweaks to set realistic expectations.
- Combine Data: Quantitative data tells you the rate; qualitative data tells you the reason.
- Validate Continuously: Treat predictions as hypotheses that must be tested and refined.
- Manage Risk: Always account for potential negative outcomes in your planning.
Predicting conversion lift is not about magic; it is about disciplined analysis. By treating your customer journey map as a dynamic model rather than a static diagram, you gain the ability to forecast the impact of your decisions. This shifts the conversation from “we think this will work” to “we calculated this will work.” In a competitive digital landscape, that precision is the difference between guessing and growing.
Start by auditing your current journey maps. Identify the friction points. Gather the data. Run the numbers. The lift is waiting to be found.