


Conversion Rate Optimization (CRO) often focuses on isolated elements—a button color, a headline tweak, or a form field. While these micro-optimizations matter, they can miss the forest for the trees. To truly understand user behavior, we must look at the entire path a visitor takes. This is where journey mapping becomes essential. By visualizing the customer experience from awareness to purchase, we uncover hidden friction points that data alone might miss.
This guide explores how to integrate journey mapping into your testing strategy. We will move beyond simple analytics and look at the narrative of the user. This approach allows for more meaningful hypotheses and tests that align with real human behavior rather than just numbers on a dashboard.
🔍 Why Journey Mapping Matters for Testing
Traditional A/B testing often operates in a vacuum. You test a landing page, and you get a result. But what happens after the click? If the landing page is optimized but the checkout flow is confusing, you lose the conversion. Journey mapping provides the context needed to prioritize tests effectively.
- Contextual Understanding: It reveals the emotional state of the user at each stage.
- Friction Identification: It highlights where users drop off and why.
- Hypothesis Accuracy: Tests are built on behavioral insights, not guesses.
- Resource Allocation: You focus efforts on high-impact areas of the funnel.
Without a map, testing is like driving in the dark with the headlights on. You can see a few feet ahead, but you cannot see the curve coming. A journey map illuminates the road ahead.
📊 Gathering Intelligence for the Map
Building a reliable map requires more than just assumptions. You need a blend of quantitative and qualitative data. This phase is about collecting the raw materials needed to construct the visual representation of the user path.
Quantitative Data Sources
Numbers tell you what is happening. Use the following sources to identify patterns:
- Web Analytics: Look for drop-off points in the funnel.
- Session Recordings: Observe mouse movements and scrolling behavior.
- Exit Pages: Identify where users leave the site most frequently.
- Time on Page: Determine where users engage deeply versus where they bounce.
Qualitative Data Sources
Numbers tell you why it might be happening. Qualitative data adds the human element:
- User Interviews: Direct conversations about motivations and pain points.
- Feedback Forms: On-page surveys asking about specific hurdles.
- Support Tickets: Analyze common complaints or confusion reported to customer service.
- Usability Testing: Watch users attempt to complete tasks in real-time.
🛣️ Constructing the User Path
Once data is collected, it is time to visualize. The map should not just be a linear list of pages. It should represent the user’s goals, actions, and emotions at each step.
Defining the Stages
Divide the journey into logical phases. Common stages include:
- Awareness: The user discovers the brand.
- Consideration: The user evaluates options.
- Decision: The user chooses a solution.
- Retention: The user continues to engage post-purchase.
Mapping Touchpoints
Identify every interaction the user has with your business. This includes:
- Social media posts
- Email newsletters
- Website landing pages
- Product pages
- Checkout forms
- Confirmation emails
- Customer support interactions
🚧 Identifying Friction Points
Friction is anything that slows down or stops progress. In a journey map, friction points are the critical areas to target for testing. They are the barriers between intent and action.
Look for signs of frustration or confusion:
- High Drop-off Rates: A sudden decrease in users between two steps.
- Long Session Duration: Users spending too much time on a single page might indicate confusion.
- Form Abandonment: Users starting a form but not finishing it.
- Reactive Behavior: Users refreshing the page or using the back button frequently.
It is vital to categorize these friction points. Some are technical, such as slow load times. Others are psychological, such as lack of trust or unclear value propositions.
Friction Type Comparison
| Friction Type | Description | Example |
|---|---|---|
| Technical | System performance issues | Page load time exceeds 3 seconds |
| Content | Unclear or missing information | Pricing details are hidden |
| Process | Too many steps required | Forced account creation before checkout |
| Emotional | Lack of trust or confidence | No security badges visible |
💡 Formulating Hypotheses from the Map
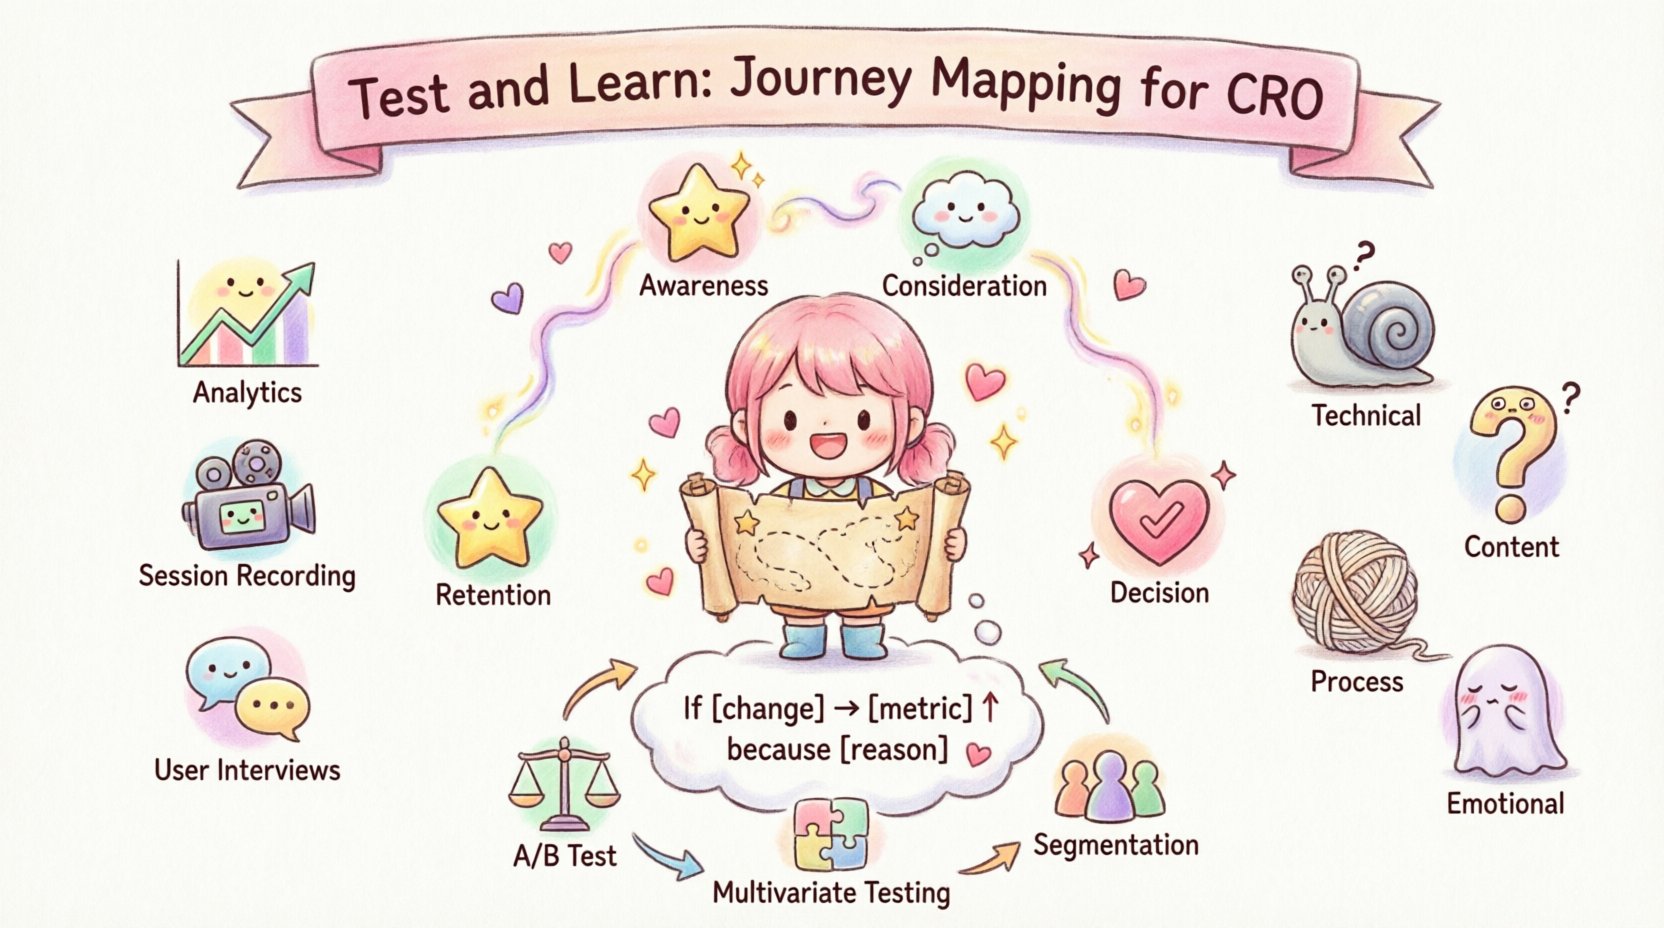
A journey map is useless if it does not lead to action. The next step is translating insights into testable hypotheses. A strong hypothesis follows a specific structure: If we change [element], then [metric] will improve because [reason].
Step-by-Step Hypothesis Generation
- Identify the Problem: “Users drop off at the pricing page.”
- Map Insight: Users are confused by the tier differences.
- Define the Solution: “Add a comparison chart.”
- Map Insight: Visual aids clarify value differences.
- Predict the Outcome: “Engagement time will increase, and conversions will rise.”
- Map Insight: Clearer information reduces anxiety.
Ensuring Hypothesis Validity
Before running a test, validate your assumption against the map:
- Does it align with user intent? Does the change help the user achieve their goal?
- Is it measurable? Can you track the impact of the change?
- Is it specific? Avoid vague changes like “improve the page.” Specify the exact element.
🧪 Executing the Test
Once the hypothesis is solid, it is time to execute. Testing should be iterative. Do not attempt to overhaul the entire journey at once. Focus on one friction point at a time.
Test Types for Journey Optimization
- A/B Testing: Compare two versions of a specific element.
- Multivariate Testing: Test multiple elements simultaneously to see interactions.
- Split URL Testing: Compare completely different page structures.
- Personalization: Show different content based on user segment.
Segmentation is Key
Not all users follow the same path. Segment your testing based on:
- Traffic Source: Users from social media may have different expectations than search users.
- Device: Mobile users often have different friction points than desktop users.
- Behavior: New visitors versus returning visitors.
- Demographics: Age or location might influence trust levels.
📈 Analyzing Results and Iterating
The journey does not end when the test results are in. Data analysis requires context. A statistically significant result might not be meaningful in the broader journey context.
Evaluating Impact
Look beyond the primary metric. Did the test improve conversion but hurt retention? Did it increase clicks but decrease time on site? You need to ensure the change aligns with long-term goals.
- Primary Metric: The main goal of the test (e.g., Conversion Rate).
- Guardrail Metrics: Metrics that should not decrease (e.g., Bounce Rate).
- Secondary Metrics: Supporting data (e.g., Average Order Value).
Updating the Map
Your journey map is a living document. As you learn from tests, update the map. If a friction point is resolved, move to the next one. If a new barrier appears, document it. This creates a continuous cycle of improvement.
⚠️ Common Pitfalls to Avoid
Even with a solid strategy, mistakes happen. Be aware of these common errors when integrating mapping into CRO.
- Assuming Linearity: User journeys are rarely straight lines. Users loop back and forth. Map the non-linear paths.
- Ignoring Mobile: Desktop behavior does not always translate to mobile. Map mobile specifically.
- Over-Optimizing: Don’t strip away every distraction. Some friction is necessary for focus.
- Ignoring Qualitative Data: Don’t rely solely on numbers. Talk to the users.
- Testing Too Early: Ensure you have enough traffic and data before making major changes.
🔄 Building a Learning Culture
The most successful teams treat testing as a learning process, not just a revenue driver. Every test, whether a win or a loss, provides data. Share these findings across the organization.
- Document Failures: What didn’t work and why?
- Celebrate Wins: Recognize the impact of successful tests.
- Share Insights: Ensure the marketing and product teams know the findings.
- Review Regularly: Schedule monthly reviews of the journey map.
🎯 Final Thoughts on Journey Testing
Conversion Rate Optimization is not just about tweaking buttons. It is about understanding the human being behind the screen. By using journey mapping, you gain a deeper empathy for your users. This empathy drives better decisions and more effective tests.
Start by mapping your current experience. Identify the friction. Formulate a hypothesis. Run the test. Analyze the results. Repeat. This cycle creates a culture of continuous improvement that keeps your business aligned with user needs.
Remember, the goal is not just to convert once, but to build a relationship. A well-mapped journey ensures that relationship starts on the right foot and continues to grow.
Begin your mapping today. The path to better conversion is clearer when you see the whole road.