
Mastering Project Scheduling with AI-Powered PERT Charts in Visual Paradigm
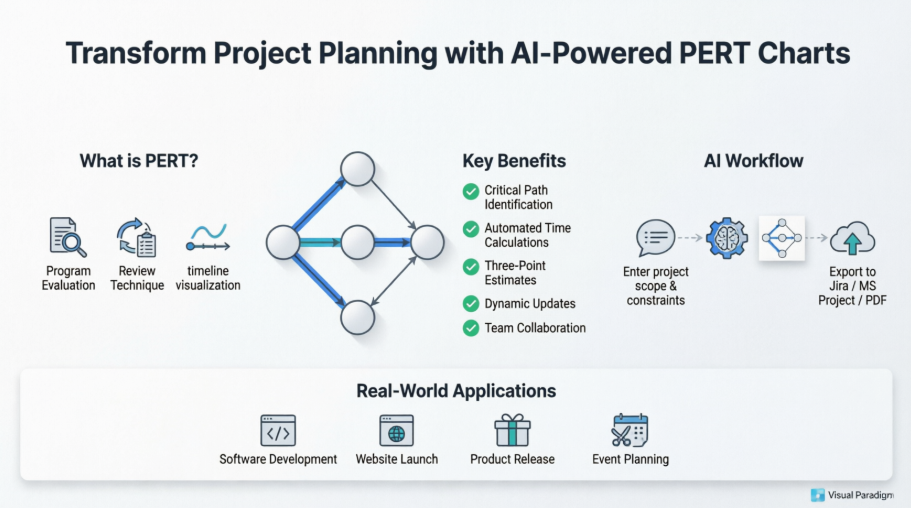
In the dynamic world of software development and product management, managing complex timelines is a constant battle. Traditional Gantt charts are excellent for tracking progress, but they often fall short when it comes to visualizing the intricate web of dependencies and probabilities that dictate a project’s success. This is where the Program Evaluation and Review Technique (PERT) chart shines, particularly when enhanced by modern AI capabilities.
This tutorial explores the architecture of a PERT chart, explains why it is superior for risk assessment, and demonstrates how to leverage Visual Paradigm’s AI-powered workflow to automate your project planning.
Understanding the Core Concepts: What is a PERT Chart?
A PERT chart is a project management tool designed to analyze and represent the tasks involved in completing a given project. Unlike a linear list or a standard timeline, a PERT chart is a network diagram that maps out the sequence of events.
At its heart, a PERT chart consists of:
- Nodes (Circles/Dots): These represent specific milestones or events. They mark the start or completion of a task.
- Arrows: These represent the tasks or activities required to move from one milestone to the next.
- Dependencies: The arrows define the logical flow. For example, Task B cannot start until Task A is finished.
The “Review Technique” aspect mentioned in the introductory image refers to the specific method of time estimation. PERT does not rely on a single guess for how long a task will take. Instead, it utilizes a Three-Point Estimation formula:
- Optimistic (O): The best-case scenario.
- Pessimistic (P): The worst-case scenario.
- Most Likely (M): The realistic estimate.
The expected time ($E$) is calculated using the weighted average formula: $E = (O + 4M + P) / 6$. This mathematical approach allows project managers to quantify risk and uncertainty.
The AI Workflow: From Chaos to Structure
Historically, building a PERT chart was a labor-intensive process involving manual data entry and complex calculations. Visual Paradigm has transformed this workflow through AI Assisted Modeling.
The system architecture follows a streamlined pipeline:
- Input Phase: You enter the project scope, constraints, and task lists into the interface. This can be done via natural language text.
- Processing (The “AI Brain”): The AI engine parses the input, identifies logical dependencies between tasks, and calculates the critical path.
- Visualization: The system generates a dynamic network diagram, highlighting the critical path in real-time.
- Export: The finalized chart is exported to tools like Jira, MS Project, or PDF for stakeholder review.
Step-by-Step: Creating a PERT Chart
Let’s walk through the modeling process using the logic demonstrated in the visual diagram.
1. Define the Project Scope
Start by defining the boundaries. In the AI workflow, you might type a prompt such as: “Plan a software launch with backend development, UI design, and QA testing.”
2. Visualizing Dependencies
Visual Paradigm automatically constructs the graph. You will see nodes connected by arrows. The tool highlights the Critical Path—the longest sequence of dependent tasks. If any task on this path is delayed, the entire project is delayed.
Here is a conceptual representation of the dependency logic often generated:
Task A (Design) --[1 day]--> Task B (Dev) --[3 days]--> Task C (QA)
Task A (Design) --[1 day]--> Task D (Content) --[2 days]--> Task C (QA)
In this scenario, the path A -> B -> C is the critical path (4 days), while A -> D -> C is shorter (3 days). The system would highlight the first path to alert you of the primary risk.
3. Dynamic Updates
One of the key benefits of the AI approach is Dynamic Updates. If you change the duration of a task or add a new dependency, the AI instantly recalculates the Critical Path and updates the timeline visualization.
Real-World Applications
While the introduction mentions software launches and marketing campaigns, PERT charts are versatile enough for various industries:
- Software Development: Managing the dependencies between backend API integration and frontend UI implementation.
- Website Launch: Coordinating domain registration, hosting setup, and content migration.
- Product Release: Aligning manufacturing, logistics, and marketing campaigns.
- Event Planning: Ensuring vendors, venue setup, and staff schedules align perfectly.
Conclusion
Moving from static Gantt charts to dynamic PERT charts powered by AI allows for a more robust approach to project management. By understanding the system architecture—where data flows from natural language input to a mathematically rigorous network diagram—you can visualize complex dependencies with confidence. Whether you are launching a website or managing a global product release, the ability to identify the critical path instantly is an invaluable asset.