
Mastering System Modeling: PlantUML, VPasCode, and AI-Driven Architecture
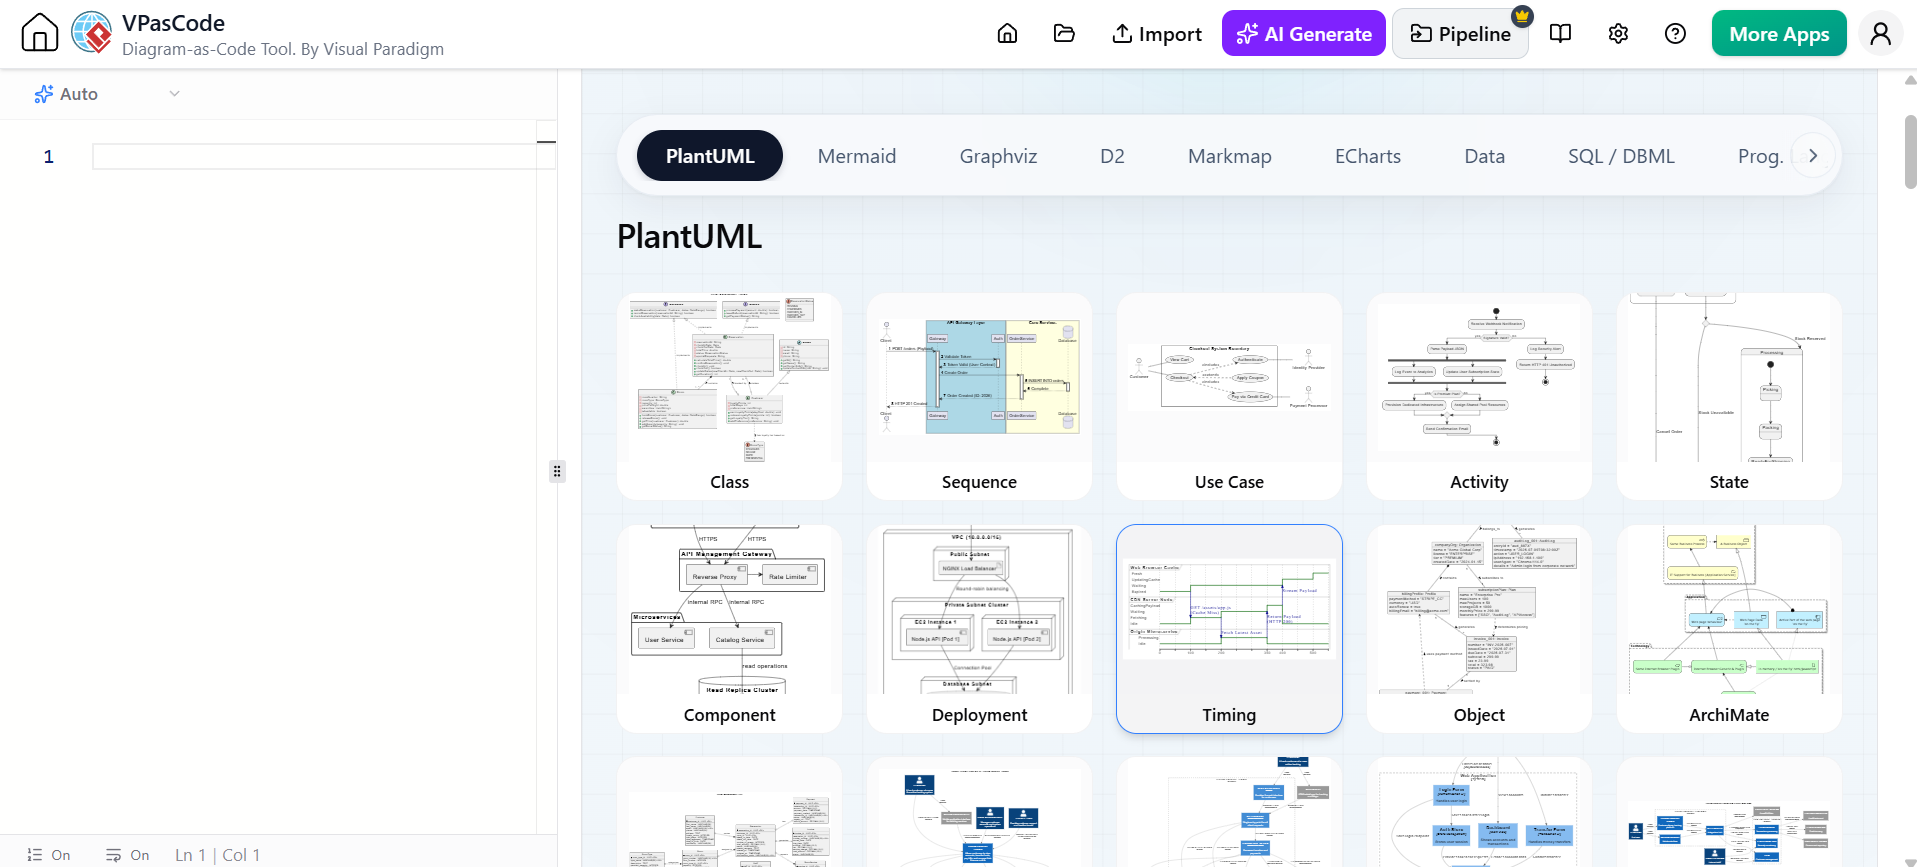
In the realm of software engineering and system architecture, clarity is king. The most complex systems often require the most precise documentation to ensure that developers, stakeholders, and architects share a common understanding. This is where Diagram-as-Code tools like VPasCode and the PlantUML engine come into play. Instead of dragging and dropping shapes with a mouse, engineers use text-based syntax to define their diagrams, allowing for version control, rapid iteration, and automated generation.
This tutorial explores the power of PlantUML, analyzing the specific diagram types available—from standard UML modeling to high-level architectural frameworks like C4 and ArchiMate. We will walk through the concepts behind these diagrams, explaining when and why to use each one.
What is PlantUML?
PlantUML is a powerful, open-source tool that allows users to create diagrams and visualizations from text. It is a “diagram-as-code” engine, meaning the visual representation of your system is generated from a simple text file. This approach offers several advantages:
- Version Control: Unlike binary image files, text files can be easily managed in Git, allowing you to see exactly what changed in a diagram over time.
- Speed: It is often faster to type a relationship line than to draw it manually.
- Maintainability: Updating a diagram is as simple as editing the source text, rather than re-arranging shapes.
In the interface shown, we see a selection of supported diagram types. Let’s break down the specific categories of diagrams that PlantUML excels at.
1. The UML Standard: Modeling Behavior and Structure
Unified Modeling Language (UML) is the industry standard for visualizing the design of a system. PlantUML supports a wide range of UML diagrams, categorized generally by what they model: behavior or structure.
Behavioral Diagrams
These diagrams focus on the dynamic aspects of a system—how things happen over time or through interaction.
- Use Case Diagrams: These are the “what” diagrams. They model the functional requirements of a system by showing the interactions between actors (users or external systems) and the system itself. They are essential for defining the scope of a project.
- Sequence Diagrams: These are the “how” diagrams regarding interaction. They show how objects interact with each other over a specific period of time. The vertical axis represents time, and the horizontal axis represents the objects involved. They are critical for understanding the flow of data between components.
- Activity Diagrams: Often used to model workflows, these diagrams represent the flow of control from activity to activity. They are similar to flowcharts but are specifically designed to model the logic of a system, handling complex branching and concurrency.
- State Diagrams (State Machine): These diagrams describe the behavior of a single object in response to events. They show the various states an object can be in (e.g., an Order being “Paid”, “Shipped”, or “Delivered”) and the transitions required to move between them.
- Timing Diagrams: A specialized type of interaction diagram that focuses on the timing of events. It shows how the state of an object changes over time, often used for real-time systems.
Structural Diagrams
These diagrams focus on the static aspects of the system—how the parts are built and related to one another.
- Class Diagrams: The backbone of object-oriented design. They show the system’s classes, their attributes, methods, and the relationships (inheritance, association, composition) between them. They provide a static snapshot of the system’s architecture.
- Component Diagrams: While class diagrams focus on code structure, component diagrams focus on the physical or logical architecture of a system. They show high-level software components (like libraries or microservices) and their dependencies.
- Deployment Diagrams: These map the physical hardware to the software. They show where components are deployed (e.g., on which servers, cloud instances, or devices) and how the network topology looks.
2. Modern Architecture Frameworks
While UML is excellent for detailed software design, modern system architecture often requires diagrams that bridge the gap between business strategy and technical implementation. PlantUML supports specialized frameworks for this purpose.
C4 Architecture Model
The C4 model is a hierarchical approach to software architecture visualization. It stands for Context, Containers, Components, and Code.
- Context Diagrams (Level 1): Show the software system as a single box and its users/external systems. It answers “What is the system?”
- Container Diagrams (Level 2): Break down the system into high-level building blocks like web apps, mobile apps, or databases.
- Component Diagrams (Level 3): Break down containers into logical components.
- Code Diagrams (Level 4): Dive deep into the actual code classes.
PlantUML allows you to create these diagrams using specific syntax, making it easy to maintain a consistent architectural view across a large team.
ArchiMate
ArchiMate is a standard for enterprise architecture. Unlike UML, which focuses heavily on software, ArchiMate provides a comprehensive view of the enterprise, bridging the gap between business, application, and technology layers.
An ArchiMate diagram helps stakeholders understand how business processes, business services, and applications interact. It is particularly useful for IT governance and strategic planning, ensuring that technical decisions align with business goals.
Conclusion: Choosing the Right Tool
Whether you are defining the specific logic of a microservice with a Sequence Diagram, planning the infrastructure with a Deployment Diagram, or explaining the business scope to a client with a Use Case Diagram, the “Diagram-as-Code” approach offers a professional, maintainable workflow.
By leveraging the flexibility of PlantUML, you ensure that your documentation remains as living, breathing artifacts of your code, rather than static images that quickly become outdated. Start by selecting the diagram language that best fits your current task, and let the text drive your design.