


In the world of software development, architecture documentation is often overlooked, misunderstood, or poorly communicated. The result? Teams struggle to understand systems, onboarding takes too long, technical debt accumulates, and collaboration breaks down.
Enter the C4 Model — a powerful, intuitive, and hierarchical approach to visualizing software architecture that solves these problems by guiding you through a structured, zoom-in process. Created by software architect Simon Brown, the C4 Model provides a clear, scalable, and practical way to document and communicate the design of any software system — from simple apps to complex enterprise platforms.
🔍 What Is the C4 Model?
The C4 Model (short for Context, Containers, Components, Code) is a hierarchical abstraction framework for visualizing software architecture using four levels of detail, each representing a different zoom level into a system.
The name “C4” comes from the four core diagram types:
-
Context
-
Containers
-
Components
-
Code
These levels follow a “zoom-in” metaphor: start with a high-level view of the system in context with its users and external systems, then progressively drill down into increasing levels of technical detail — only where necessary.
This approach avoids the common pitfall of creating one massive, unreadable diagram that tries to show everything at once.
🧭 The Four Levels of the C4 Model
Below is a detailed breakdown of each level, including what it shows, who it’s for, and how many diagrams you typically create.
| Level | Diagram Type | Cardinality (Typical) | What It Shows | Primary Audience |
|---|---|---|---|---|
| 1 | System Context | 1 per software system | The software system as a single box, its users (actors), and external systems it interacts with | Stakeholders, managers, new team members |
| 2 | Container | 1 per system | Major deployable/runnable units (containers) inside the system and their interactions | Developers, architects, DevOps |
| 3 | Component | 0–n per container | Internal structure of a container: components, their responsibilities, and interactions | Developers working within a container |
| 4 | Code | 0–few (rare) | Implementation details of a single component (e.g., class diagrams, sequence diagrams, code snippets) | Developers needing deep insight |
Let’s explore each level in detail.
🟦 Level 1: System Context Diagram
The Big Picture – Who Uses It and How It Fits In
Purpose:
To answer: “What is this system, and how does it relate to people and other systems?”
What It Shows:
-
A single box representing the software system.
-
Actors (users): People or systems that interact with your software (e.g., Customer, Admin, Payment Gateway).
-
External systems: Other systems the software interacts with (e.g., Mainframe Banking System, Email Service, Identity Provider).
-
Interactions between the system and actors/external systems, shown with labeled arrows (e.g., “Sends email”, “Queries account data”).
Why It Matters:
-
Provides immediate clarity on scope and boundaries.
-
Ideal for onboarding new team members or explaining the system to non-technical stakeholders.
-
Avoids scope creep by clearly defining what’s in the system and what’s external.
✅ Typical Cardinality: 1 diagram per software system
🎯 Example:
For an Internet Banking System, the context diagram shows:
Actors: Personal Customer, Business Customer
External Systems: Mainframe Banking System, Email Service, Mobile Carrier API
Arrows: “Requests balance”, “Sends transaction notification”, “Authenticates via OAuth”
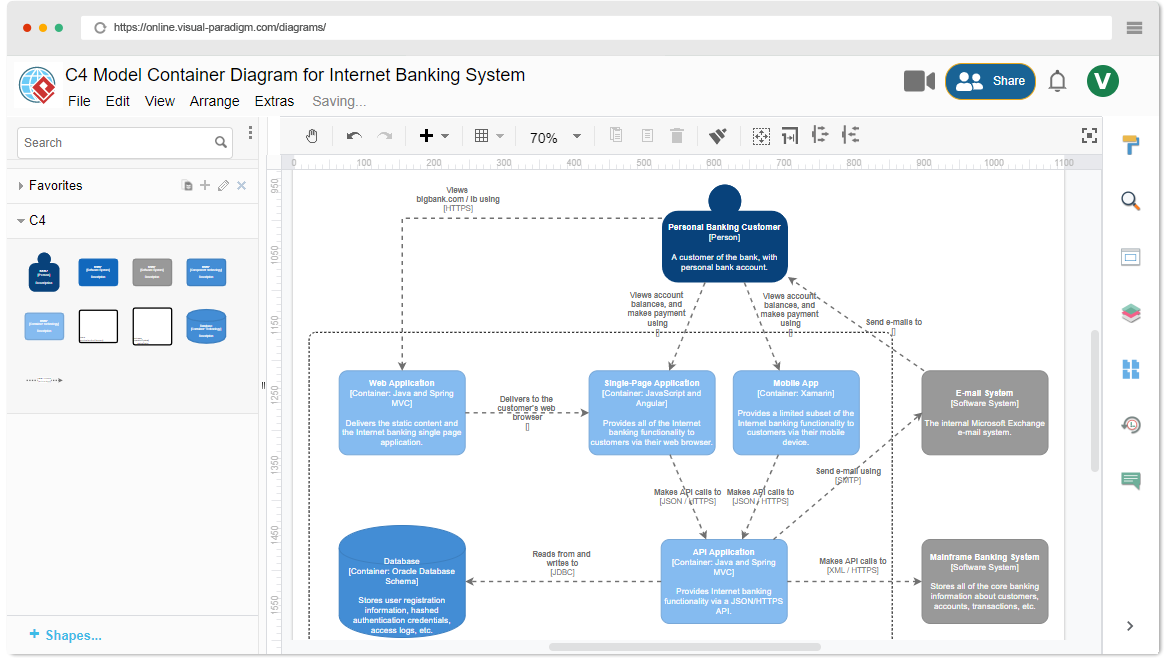
🟨 Level 2: Container Diagram
The Architecture Zoom – What Runs Where?
Purpose:
To answer: “What are the major components of the system, and how do they communicate?”
What It Shows:
-
The software system from Level 1, now broken down into deployable units called containers.
-
Common container types:
-
Web application (e.g., React SPA, Angular app)
-
Mobile app (iOS/Android)
-
Backend API (e.g., Spring Boot, .NET Core, Node.js)
-
Database (e.g., PostgreSQL, MongoDB)
-
Message broker (e.g., Kafka, RabbitMQ)
-
Microservices (if applicable)
-
-
Interactions between containers, labeled with:
-
Communication protocol (e.g., HTTP, gRPC, AMQP)
-
Data format (e.g., JSON, XML)
-
Direction of flow
-
Why It Matters:
-
Reveals architectural decisions: monolith vs. microservices, where logic lives, how data flows.
-
Helps identify potential bottlenecks, coupling, and integration points.
-
Useful for DevOps, QA, and cross-team collaboration.
✅ Typical Cardinality: 1 diagram per software system (most common level)
🎯 Example:
In the Internet Banking System, the container diagram includes:
Frontend (SPA) – React app served via CDN
API Gateway – Spring Boot backend
Database (PostgreSQL) – Stores user accounts, transactions
Email Service (external) – Sends notifications
Message Queue (Kafka) – Handles async alerts
🔗 Arrows:
SPA → API Gateway (HTTP/JSON)
API Gateway → PostgreSQL (JDBC)
API Gateway → Kafka (publish event)
Kafka → Email Service (event-driven)
🟥 Level 3: Component Diagram
The Internal Structure – What Makes Up a Container?
Purpose:
To answer: “How is this container structured internally? What are its key building blocks?”
What It Shows:
-
A single container (e.g., the API Gateway) zoomed in.
-
Its components — logical units of functionality (e.g., Security, Authentication, Transaction Service, Notification Service).
-
Dependencies between components (e.g.,
TransactionServicedepends onAccountRepository) -
Responsibilities (often written as brief descriptions)
Why It Matters:
-
Clarifies the internal modularity and separation of concerns.
-
Highlights architectural patterns like layered architecture, hexagonal architecture, or clean architecture.
-
Helps developers understand where to implement new features or debug issues.
✅ Typical Cardinality: 0 to n diagrams per system
(Only create for containers that are complex or architecturally significant)
🎯 Example:
In the API Gateway container, you might define these components:
Authentication Component – Handles JWT validation
Transaction Component – Manages fund transfers
Account Component – Retrieves account balance
Notification Component – Sends alerts via email/SMS
Monitoring Component – Logs metrics and traces
⚙️ Arrows show dependency:
Transaction Component→Account Component(reads data)
Notification Component→Email Service(external call)
💡 Tip: Use UML class diagrams, component diagrams (UML), or even simple boxes with labels.
🟩 Level 4: Code Diagram
The Implementation Detail – How Does It Actually Work?
Purpose:
To answer: “How is this component implemented? What are the key classes or methods?”
What It Shows:
-
A single component from Level 3, represented at the code level.
-
Classes, interfaces, methods, inheritance, dependencies, and control flow.
-
Often shown as:
-
UML Class Diagram
-
Sequence Diagram (for complex flows)
-
Code snippets (e.g., a key method or class)
-
Why It Matters:
-
Provides implementation-level clarity for complex or tricky logic.
-
Helps with debugging, code reviews, and understanding edge cases.
✅ Typical Cardinality: 0 to few per system
(Only when absolutely needed — often skipped)
🎯 Example:
For theTransferFundsuse case in the Transaction Component, you might draw:
A sequence diagram showing:
Client → API → Service → Repository → DB
Checks balance → locks transaction → updates both accounts
Handles rollback on failure
Or a class diagram showing:
TransferService,TransferRequest,AccountRepository,Transaction,InsufficientFundsException
⚠️ Caution:
Avoid overusing code-level diagrams. They’re not for general documentation.
Often, source code itself is better than a static diagram.
Use diagrams only when they add value — e.g., for complex business logic, state machines, or concurrency issues.
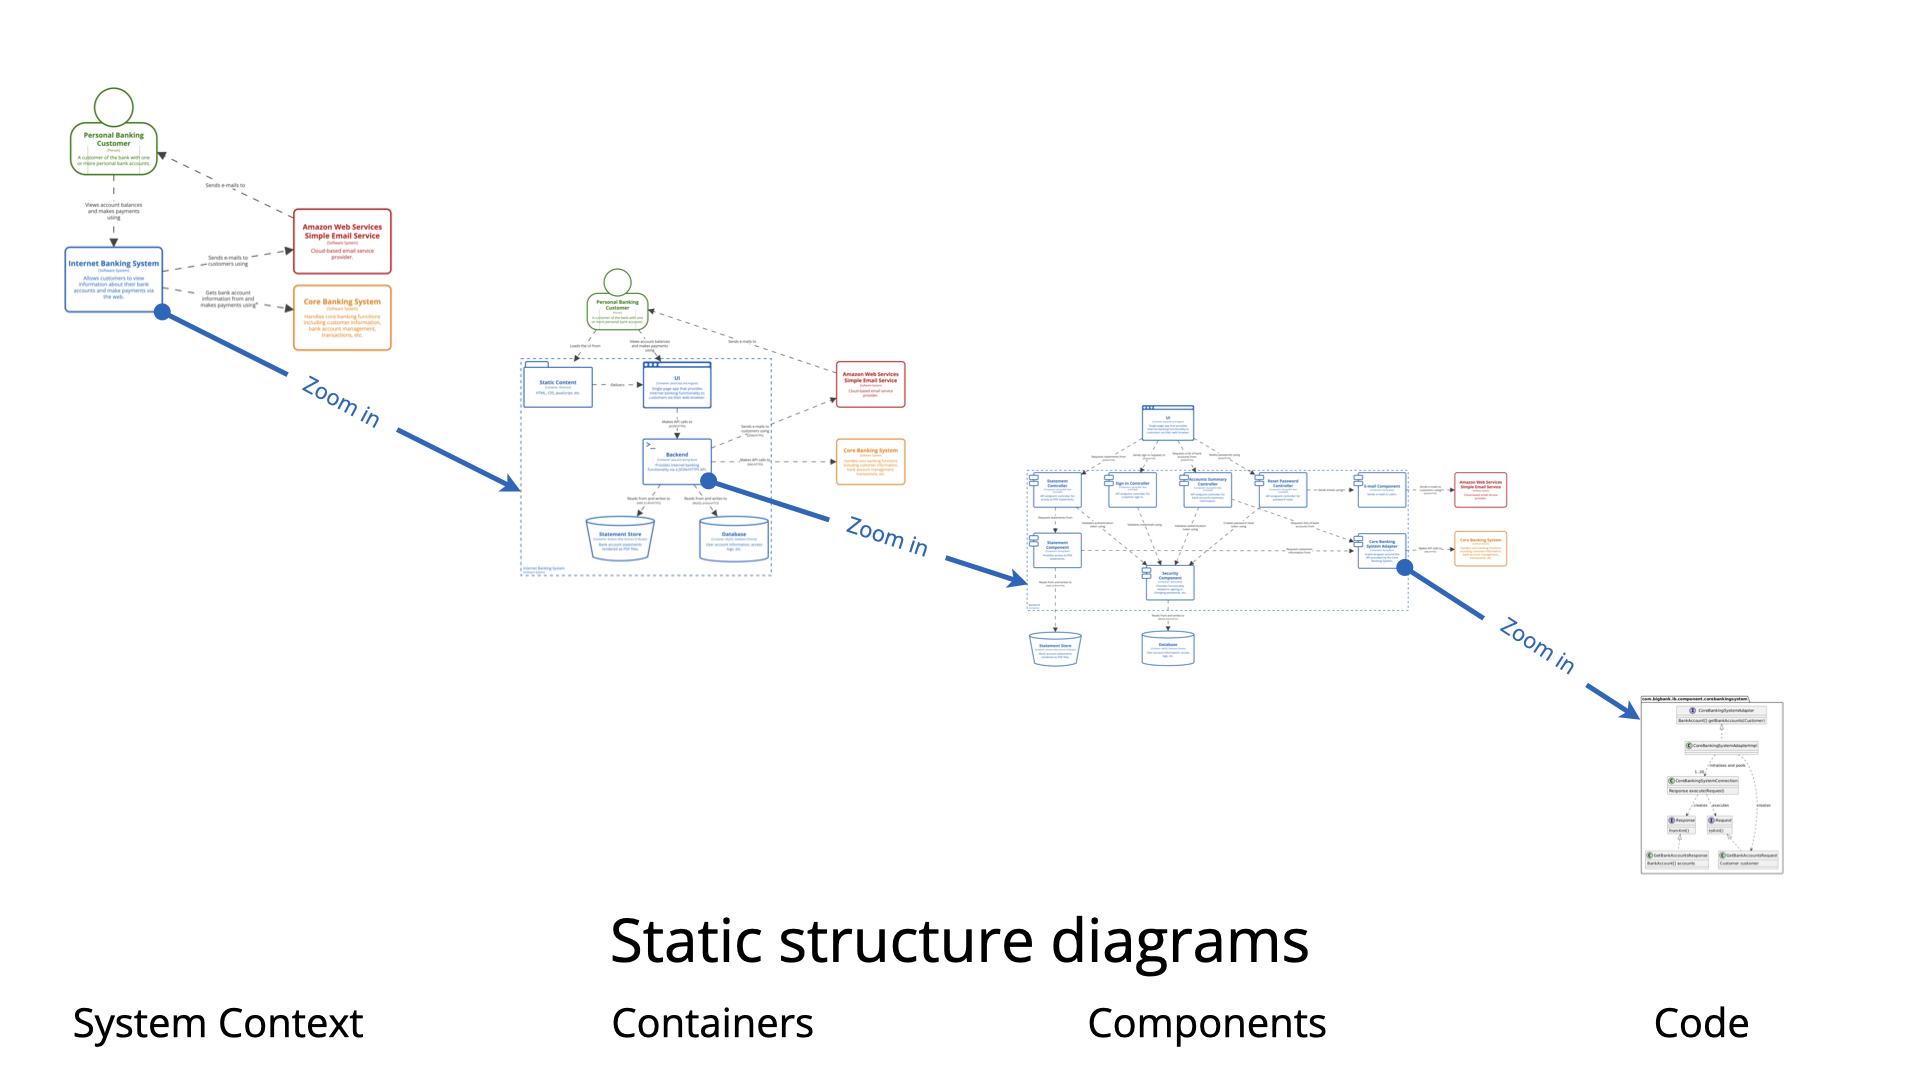
📈 The Zoom Pattern: A Visual Summary
[Level 1: System Context]
       │
       ▼
[Level 2: Container Diagram]
       │
       ▼
[Level 3: Component Diagram] → (only for key containers)
       │
       ▼
[Level 4: Code Diagram] → (only for critical components)
This progressive zoom-in pattern ensures that:
-
You start with a clear, high-level view.
-
You only add detail where needed.
-
You avoid overwhelming stakeholders with technical clutter.
🏗️ Best Practices for Using the C4 Model
-
Start with Context
Always begin with the System Context diagram. It defines your scope and sets the stage. -
Use One Container Diagram per System
It’s rare to need more than one. If you do, ask: Is this truly a separate system, or just a container? -
Create Component Diagrams Strategically
Focus on architecturally significant containers — the ones that are complex, changing often, or central to the business logic. -
Use Code Diagrams Sparingly
Only when the implementation is non-trivial or hard to grasp from code alone. -
Keep Diagrams Simple and Consistent
Use standard shapes:-
Boxes for systems, containers, components
-
Circles for actors
-
Arrows for interactions (labeled!)
-
Color coding for types (e.g., blue for web apps, green for databases)
-
-
Document Your Assumptions
Add a legend or notes explaining:-
Technology stack
-
Deployment strategy
-
Assumptions (e.g., “Assumes OAuth 2.0 with JWT”)
-
Why certain decisions were made
-
-
Automate Where Possible
Tools like:-
Visual Paradigm AI Platform
Can help generate diagrams from code or templates.
-
🌐 Real-World Example: Internet Banking System
Let’s walk through the full C4 journey for an Internet Banking System.
🟦 Level 1: System Context
-
System: Internet Banking System
-
Actors: Personal Customer, Business Customer
-
External Systems: Mainframe Banking System, Email Service, Mobile Carrier API
-
Interactions:
-
Customer → System: “Requests balance”
-
System → Email Service: “Sends transaction alert”
-
🟨 Level 2: Container Diagram
-
Containers:
-
Frontend (React SPA)
-
API Gateway (Spring Boot)
-
Database (PostgreSQL)
-
Message Queue (Kafka)
-
-
Interactions:
-
SPA → API Gateway (HTTP/JSON)
-
API Gateway → PostgreSQL (JDBC)
-
API Gateway → Kafka (publish event)
-
Kafka → Email Service (event-driven)
-
🟥 Level 3: Component Diagram (API Gateway)
-
Components:
-
Authentication Component
-
Transaction Component
-
Account Component
-
Notification Component
-
-
Dependencies:
-
Transaction Component→Account Component(reads account data) -
Notification Component→Email Service(external call) -
Authentication Component→JWT Service(internal utility)
-
🔍 Why this matters:
This diagram reveals that the Transaction and Account components are tightly coupled — a key insight for future refactoring or microservice decomposition.
🟩 Level 4: Code Diagram (Optional – for TransferFunds Use Case)
Scenario: A user initiates a fund transfer between accounts.
✅ Use a Sequence Diagram to show the flow:
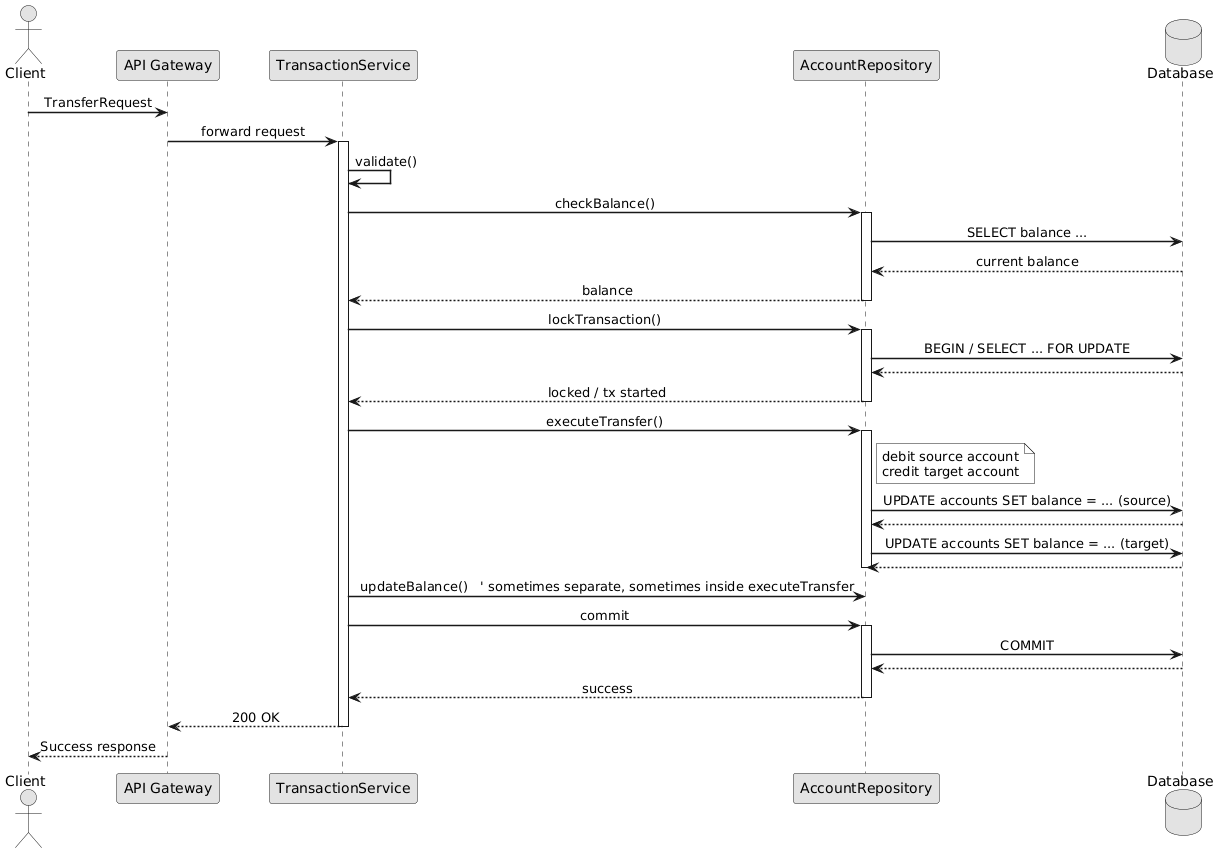
💡 Insight:
This sequence reveals the transactional boundary, locking strategy, and error handling — all critical for correctness and performance.
Alternatively, a UML Class Diagram could show:
-
TransferService -
TransferRequest(DTO) -
TransferResult -
AccountRepository(interface) -
Account(entity) -
InsufficientFundsException
✅ Value: This helps developers understand the structure and flow without reading every line of code.
📌 Why the C4 Model Works: Key Benefits
| Benefit | Explanation |
|---|---|
| ✅ Clear Communication | Stakeholders see the big picture; developers get the detail they need. |
| ✅ Scalable & Flexible | You can stop at Level 2 for most systems. Only go deeper when needed. |
| ✅ Avoids Over-Documentation | No need to draw every class or module. Focus on what matters. |
| ✅ Improves Onboarding | New hires understand the system in hours, not days. |
| ✅ Supports Refactoring & Evolution | Visuals help identify coupling, redundancy, and complexity. |
| ✅ Aligns Teams | Shared understanding across Dev, QA, DevOps, and management. |
🚫 Common Pitfalls to Avoid
| Mistake | Why It’s Bad | How to Fix |
|---|---|---|
| Drawing all 4 levels for every system | Overkill, wastes time, confuses readers | Only go to Level 3 for complex containers; skip Level 4 unless critical |
| Using too many colors or complex shapes | Confuses rather than clarifies | Stick to 2–3 colors; use consistent icons |
| Ignoring the context diagram | Leads to scope ambiguity | Always start with Level 1 |
| Treating diagrams as static artifacts | They should evolve with the system | Update diagrams regularly during refactoring or feature delivery |
| Using code-level diagrams for everything | Leads to clutter and maintenance burden | Use code itself or high-level diagrams instead |
📚 Final Thoughts: Why You Should Adopt the C4 Model
The C4 Model is not just a diagramming technique — it’s a mindset for thinking about software architecture.
It teaches us to:
-
Think in abstractions, not just code.
-
Communicate clearly, at the right level of detail.
-
Focus on value, not just complexity.
-
Build shared understanding across teams and roles.
🎯 As Simon Brown says:
“The goal is to make your architecture understandable to everyone — from the CEO to the junior developer.”
📘 Resources & Further Reading
-
🔗 Official C4 Website: https://c4model.com
→ Abstractions, Diagrams, Examples, Best Practices -
📘 Book: Software Architecture: The Hard Parts by Neal Ford & Simon Brown
→ Explores the philosophy behind C4 and real-world application -
🎥 YouTube: Simon Brown’s talks (e.g., “The C4 Model: A Visual Approach to Software Architecture”)
-
🧩 GitHub Repos:
-
https://github.com/structurizr/java – Structurizr Java SDK
-
https://github.com/mermaid-js/mermaid – Mermaid syntax examples
-
✅ Summary: The C4 Model in a Nutshell
| Level | Name | Purpose | When to Use |
|---|---|---|---|
| 1 | System Context | Show the big picture: who uses the system and what it connects to | Always — start here |
| 2 | Container | Show deployable units and their interactions | For every system — core level |
| 3 | Component | Show internal structure of key containers | Only for complex or important containers |
| 4 | Code | Show implementation details of critical components | Only when needed — rare |
🧩 Golden Rule:
“Start broad, zoom in only when necessary.”
🏁 Conclusion
The C4 Model is one of the most effective tools for documenting and communicating software architecture in a way that’s clear, scalable, and collaborative.
Whether you’re building a startup MVP or managing a large enterprise system, the C4 Model helps you:
-
Understand your system better
-
Communicate with stakeholders
-
Onboard new developers faster
-
Evolve your architecture with confidence
🔄 Don’t just build software — document it wisely.
Let the C4 Model be your guide.
📌 Now go create your first C4 diagram — and start zooming in!
💡 Your future self, your team, and your stakeholders will thank you.
-
The Ultimate Guide to C4-PlantUML Studio: Revolutionizing Software Architecture Design: This resource explains how the studio combines AI-driven automation, the structural clarity of the C4 model, and the flexibility of PlantUML (an open-source UML tool) to solve documentation bottlenecks.
-
Ultimate Guide to C4 Model Visualization Using Visual Paradigm’s AI Tools: A comprehensive guide on leveraging specialized AI features to automate and enhance the creation of hierarchical C4 model diagrams for faster system design.
-
AI-Powered UML Class Diagram Generator by Visual Paradigm: This page details an advanced tool that automatically generates UML class diagrams from natural language descriptions, significantly streamlining the software design process.
-
Visual Paradigm – AI-Powered UML Sequence Diagrams: This article demonstrates how to produce professional UML sequence diagrams directly from text prompts using an integrated AI modeling suite.
-
Comprehensive Tutorial: Generating and Modifying C4 Component Diagrams with AI Chatbot: A step-by-step guide illustrating how to use a conversational assistant to create and refine the internal structure of software systems through the C4 model’s component level.
-
Major Upgrade to AI UML Component Diagram Generation in Visual Paradigm AI Chatbot: An official update detailing enhancements that make the AI chatbot an indispensable tool for generating modular UML component structures.
-
AI-Powered Sequence Diagram Refinement Tool | Visual Paradigm: This resource discusses how AI can automatically optimize and suggest improvements for existing sequence diagrams, ensuring structural correctness and clarity.
-
Beyond the Code: How AI Automates C4 Model Diagrams for DevOps and Cloud Teams: A detailed guide on using an AI assistant to automate the full C4 modeling lifecycle through simple conversational prompts, ensuring consistency across all abstraction levels.
-
AI Diagram Generator: Complete C4 Model Support: An announcement regarding the release of a specialized AI engine capable of automated creation of C4 model diagrams to support complex architectural documentation.
-
How AI Enhances Class Diagram Creation in Visual Paradigm: This blog post explores how the integration of AI automates and improves the accuracy of creating UML class diagrams, making software design faster for development teams.