


Software architecture relies heavily on visual communication. When a developer, product manager, or stakeholder looks at a diagram, they should immediately grasp the system’s structure without needing a verbal explanation. However, class diagrams often become tangled webs of symbols and abbreviations that confuse more than they clarify. An interactive style guide for these diagrams ensures consistency, reduces ambiguity, and accelerates team alignment.
This guide outlines the standards necessary for creating class diagrams that function as effective communication tools rather than technical art. By adhering to these principles, teams can minimize misinterpretation and maintain a shared mental model of the software system.
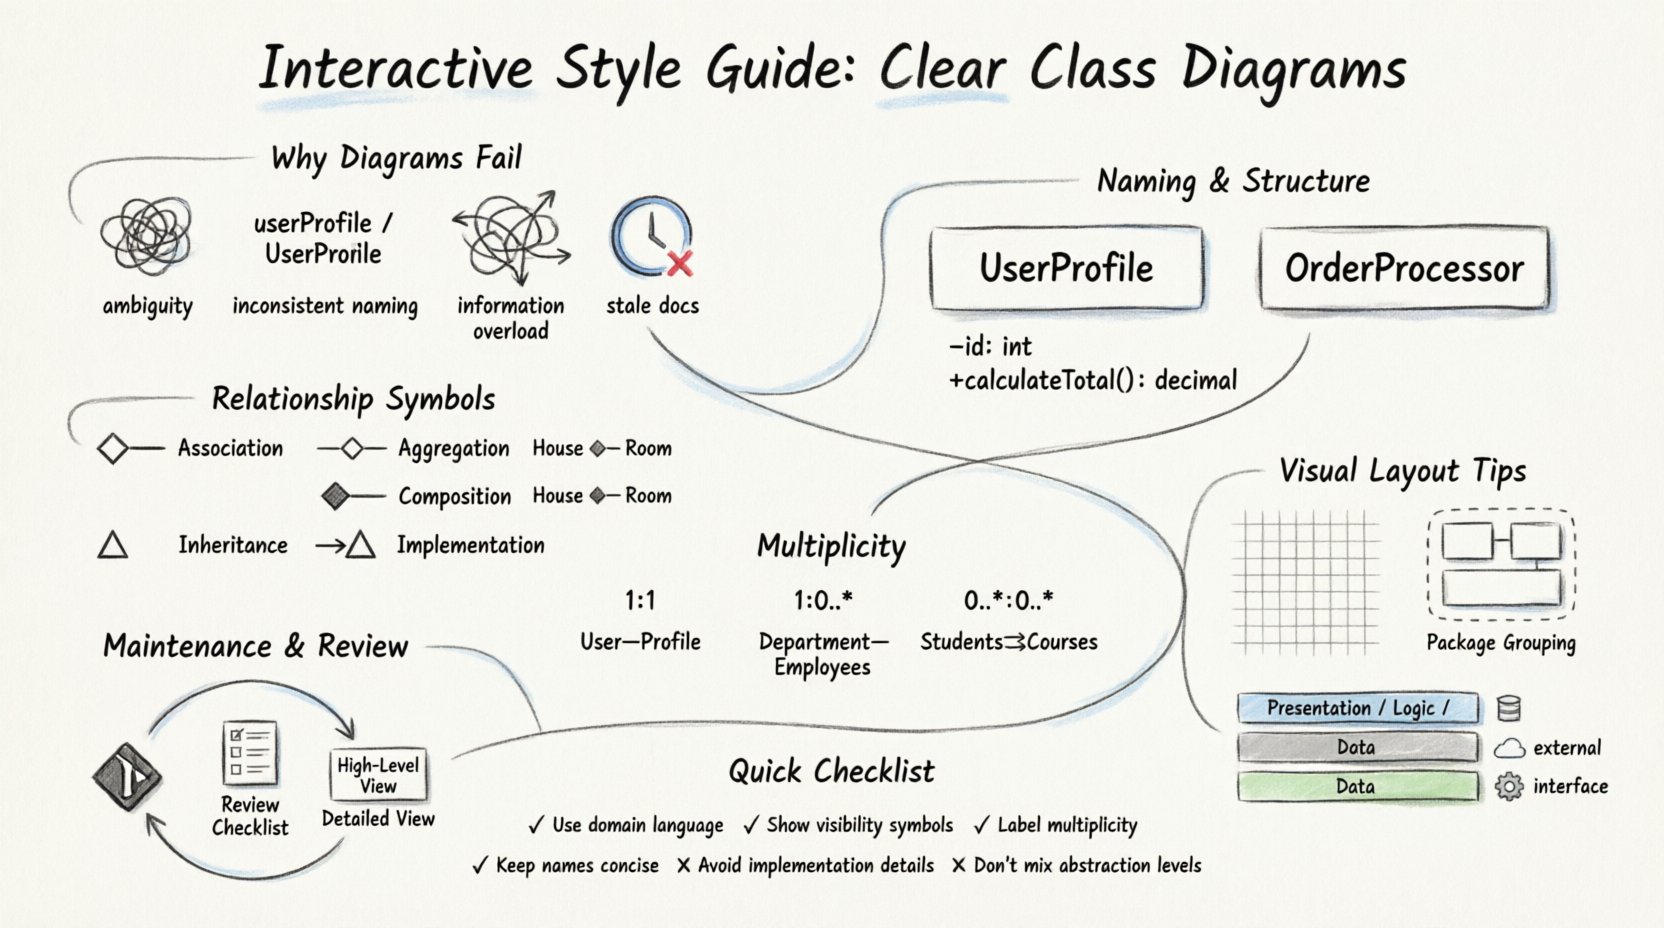
Why Class Diagrams Often Fail to Communicate 🤔
Before establishing standards, it is crucial to understand why diagrams frequently fall short. Poorly constructed diagrams create technical debt that manifests as bugs, delayed timelines, and frustrated team members.
- Ambiguity in Relationships: Without clear definitions, it is difficult to distinguish between ownership and dependency.
- Inconsistent Naming: Mixing camelCase, PascalCase, and snake_case creates visual noise and slows reading speed.
- Information Overload: Including every attribute and method in a single view obscures the high-level architecture.
- Stale Documentation: Diagrams that are not updated alongside code become misleading artifacts.
Addressing these issues requires a disciplined approach to design. The following sections detail the specific rules for creating diagrams that withstand scrutiny and remain useful over time.
Core Principles of Class Naming and Structure 🏷️
The foundation of a readable class diagram lies in its naming conventions. Names act as the primary identifiers for the logic contained within the structure. Consistent naming reduces the cognitive load required to interpret the diagram.
Class Naming Conventions
Class names should represent nouns or noun phrases that describe an entity within the business domain. Avoid generic terms like Manager, Service, or Util unless they are part of a widely accepted pattern in your specific architecture.
- Use PascalCase: Start every word with a capital letter (e.g.,
UserProfile,OrderProcessor). - Keep it Concise: Aim for names under three words. If a name is longer, consider if the class is doing too many things.
- Reflect Domain Language: Use terminology agreed upon by business stakeholders. If the business calls it a Customer, do not name the class
Client.
Attribute and Method Visibility
Visibility modifiers indicate how data is accessed. Displaying these symbols clearly helps developers understand encapsulation boundaries.
- Public (+): Accessible from any class.
- Private (-): Accessible only within the class itself.
- Protected (#): Accessible within the class and its subclasses.
- Static (~): Belongs to the class rather than an instance.
When drawing the diagram, include the visibility symbol before the name. This small detail prevents confusion regarding access control policies. For example, write -id: int instead of just id: int.
Method Signatures
Methods should be listed with their return types. This clarifies the data flow between classes.
- Include Return Types: Write
+calculateTotal(): decimalrather than+calculateTotal(). - Limit Method Lists: If a class has over 10 methods, consider grouping them or simplifying the diagram to show only key operations.
- Use Singular Verbs: Name actions clearly (e.g.,
save,fetch,update).
Mapping Relationships with Precision 🔄
Relationships define how classes interact. Misinterpreting these connections can lead to incorrect implementation logic. The following table standardizes the symbols and meanings used in the style guide.
| Relationship Type | Symbol | Meaning | Example |
|---|---|---|---|
| Association | — | A link between two classes. | Student — Course |
| Aggregation | ◇— | A whole-part relationship where parts can exist independently. | Department ◇— Professor |
| Composition | ◆— | A strong whole-part relationship where parts cannot exist without the whole. | House ◆— Room |
| Inheritance | △ | One class inherits from another. | Car △ Vehicle |
| Implementation | ⟶△ | A class implements an interface. | DatabaseConnection ⟶⟶ IStorage |
Understanding the difference between Aggregation and Composition is critical. Aggregation implies a shared lifecycle. Composition implies exclusive ownership. If the parent class is destroyed, the child objects in a composition are destroyed as well.
Multiplicity and Cardinality
Indicate the number of instances involved in a relationship. This prevents assumptions about data volume and structure.
- One-to-One (1:1): A user has exactly one profile.
- One-to-Many (1:0..*): A department has zero or many employees.
- Many-to-Many (0..*:0..*): Students can enroll in many courses, and courses can have many students.
Place these numbers near the ends of the association lines. Do not rely on the reader to guess the count.
Visual Layout and Hierarchy Standards 🎨
Visual clutter is the enemy of comprehension. A well-organized diagram guides the eye naturally from the entry point to the core logic. Use a grid system to align classes and maintain consistent spacing.
Grouping and Packages
When a diagram becomes too large, use packages or folders to group related classes. This modularizes the view without losing the context of the connections.
- Layered Architecture: Group classes by layer (e.g., Presentation, Logic, Data).
- Domain Grouping: Group classes by business domain (e.g., Billing, User Management, Inventory).
- Color Coding: Use distinct background colors for different architectural layers to differentiate responsibility boundaries.
Spacing and Alignment
Consistent spacing prevents the diagram from looking like a chaotic sketch.
- Uniform Padding: Ensure equal distance between class boxes.
- Orthogonal Lines: Use right-angle lines for connections instead of diagonal curves to reduce visual noise.
- Avoid Crossings: Arrange classes so that relationship lines do not cross unnecessarily.
Iconography and Emojis
While formal UML uses geometric shapes, adding subtle icons or emojis can speed up recognition for cross-functional teams.
- Database Tables: Add a cylinder icon (🗄️) to indicate persistent storage classes.
- External Systems: Use a cloud icon (☁️) for third-party integrations.
- Interfaces: Use a gear icon (⚙️) to signify configuration or interface definitions.
Documentation and Maintenance Protocols 🛠️
A diagram is a living document. If it does not evolve with the code, it becomes a liability. Establish protocols for keeping the visual representation accurate.
Version Control
Store diagram files in the same repository as the source code. This ensures that changes to the diagram are reviewed alongside code changes in the same pull request.
- Commit Messages: Reference the diagram file in commits that modify structure.
- Tagging: Tag releases to correlate specific diagram versions with software versions.
Review Cycles
Include diagram updates in the standard code review process. Developers should not merge code that breaks the documented architecture.
- Architectural Review: Designers and architects review major structural changes.
- Peer Review: Team members verify that the diagram matches the actual implementation.
Handling Complexity
Not every detail needs to be visible in every view. Use abstraction to manage complexity.
- High-Level Views: Show only top-level classes and major dependencies for stakeholder meetings.
- Detailed Views: Show attributes and methods for developer onboarding or debugging sessions.
- Hide Irrelevant Data: Do not display private implementation details unless they are critical to understanding the flow.
Reviewing Diagrams for Team Alignment 🤝
The ultimate goal of a class diagram is to facilitate understanding. Regular reviews ensure that the team remains aligned.
The Walkthrough Method
Schedule sessions where a developer walks the team through a diagram without referencing the code. If the team cannot follow the logic based solely on the visual, the diagram needs simplification.
- Identify Gaps: Note where the team asks questions about missing information.
- Clarify Ambiguities: Add notes or comments to resolve confusion immediately.
- Validate Assumptions: Ensure the diagram matches the team’s mental model of the system.
Feedback Loops
Encourage feedback from all levels of the team. Junior developers often spot confusion that senior staff overlook.
- New Hires: Use the diagram as an onboarding tool. If it takes a new hire more than two hours to understand the system, the documentation is too dense.
- Non-Technical Stakeholders: Ensure business stakeholders can read the diagram to understand how their requests affect the system.
Common Pitfalls and How to Avoid Them 🚫
Avoiding mistakes is as important as following best practices. Review the following list to ensure your diagrams remain clear and effective.
- Do not include implementation details: Avoid showing database columns unless the class represents a specific table.
- Do not use vague labels: Avoid terms like Thing or Data. Be specific.
- Do not ignore lifecycle: Ensure the diagram reflects how objects are created and destroyed.
- Do not mix levels of abstraction: Do not place an interface next to a concrete implementation without a clear line separating them.
- Do not skip relationships: If Class A uses Class B, draw the line. Missing lines imply a lack of dependency that does not exist.
Establishing the Style Guide for Your Team 📝
Creating a style guide is an investment in team efficiency. It reduces the time spent explaining diagrams and increases the quality of the code produced.
Steps to Implementation
- Define the Standards: Write down the rules for naming, symbols, and layout.
- Train the Team: Hold a workshop to explain the standards and demonstrate examples.
- Provide Templates: Create starter files with the correct layout and styles pre-configured.
- Enforce via Linting: If possible, use tools to check for consistency in diagram syntax.
- Iterate: Review the guide annually and update it based on team feedback.
Benefits of Consistency
- Faster Onboarding: New members can read diagrams without confusion.
- Better Collaboration: Everyone speaks the same visual language.
- Reduced Errors: Clear diagrams reveal logic errors before coding begins.
- Preserved Knowledge: The system design remains understandable even after team members leave.
Final Thoughts on Diagram Clarity 🎯
Creating clear class diagrams is an exercise in empathy. It requires putting yourself in the shoes of someone who needs to understand the system without prior knowledge. By following these standards, teams can build diagrams that serve as reliable blueprints rather than confusing puzzles.
Consistency is key. When every team member follows the same rules for naming, relationships, and layout, the diagrams become a universal language. This shared understanding reduces friction, speeds up development, and ensures that the architecture remains robust as the system grows.
Start applying these guidelines today. Review your existing diagrams against the checklist provided. Make the necessary adjustments to align with the new standards. Over time, the clarity of your documentation will improve, leading to better software design and a more cohesive team dynamic.