


Developing complex technology products requires more than just code. It requires a clear understanding of how value is created, delivered, and captured. The Business Model Canvas (BMC) offers a structured framework to map out these dynamics. When applied to technology, the standard nine blocks take on specific nuances regarding scalability, infrastructure, and user acquisition.
This guide addresses the most frequent questions regarding the application of this strategic tool in high-tech environments. We will explore how to structure your strategy without relying on specific software platforms, focusing instead on fundamental business logic and operational realities. 🔧
Q1: What makes the Business Model Canvas different for tech products compared to traditional businesses? 💻
The core structure remains the same, but the weight and interaction of the blocks shift significantly. Traditional businesses often rely on physical assets and linear supply chains. Complex tech products operate on digital infrastructure, network effects, and rapid iteration.
- Scalability: Marginal costs for serving additional customers often approach zero in software, unlike manufacturing.
- Speed of Change: Market feedback loops are shorter. The canvas must be treated as a living document, updated frequently.
- Intangible Assets: Intellectual property and data often hold more value than physical machinery.
For tech teams, the canvas serves as a communication bridge between engineering, product management, and business stakeholders. It ensures that technical decisions align with commercial viability.
Q2: How do I define the Value Proposition for a complex technical solution? 🎯
In the tech sector, the value proposition must address both functional utility and technical constraints. A product might be powerful, but if it is too difficult to integrate, the value diminishes.
When filling this block, consider the following dimensions:
- Performance: Speed, latency, uptime, and reliability metrics.
- Integration: How easily does this connect with existing systems? API availability is crucial here.
- Security: Data protection and compliance standards are often primary drivers for enterprise clients.
- Usability: Even complex backend tools need intuitive interfaces to reduce training costs.
Avoid generic claims like “fast” or “secure.” Be specific. For example, instead of saying “high performance,” state “processes 10,000 transactions per second with 99.9% uptime.” Specificity builds trust.
Q3: Who exactly are the Customer Segments in B2B and B2C tech? 👥
Identifying the right audience is critical. In technology, the user is not always the buyer. This distinction is vital for the Canvas.
B2B Tech Scenarios
- The Decision Maker: CTO or CIO focused on security, cost, and ROI.
- The Technical Evaluator: Engineers who assess feasibility and integration effort.
- The End User: Employees who actually use the tool daily. Their adoption rate impacts churn.
B2C Tech Scenarios
- Early Adopters: Users comfortable with beta features and new interfaces.
- Mass Market: Users seeking reliability and familiarity.
- Niche Enthusiasts: Users with specific needs that general products do not meet.
Your Value Proposition must resonate with the Decision Maker, while the User Experience must satisfy the End User. Balancing these conflicting needs is a primary challenge in tech strategy.
Q4: What are the viable Revenue Streams for software and digital services? 💰
Tech products offer diverse monetization models. The choice here dictates your Cash Flow and Customer Lifetime Value (LTV).
- Subscription (SaaS): Recurring revenue provides predictability. Common for tools that require ongoing maintenance or cloud hosting.
- Freemium: Basic features are free, premium features cost money. This lowers acquisition barriers but requires high conversion rates.
- Licensing: One-time fees for perpetual use. Less common now but still relevant for enterprise on-premise solutions.
- Transaction Fees: Taking a cut of every transaction processed through the platform.
- Data Monetization: Aggregating anonymized data to provide industry insights (requires strict privacy compliance).
Selecting the right model depends on your Cost Structure and Customer Segments. A high-touch enterprise solution might not fit a low-cost freemium model.
Q5: How should Key Activities be structured for a technology team? ⚙️
Key Activities are the most important actions a company must take to make its business model work. In tech, these are rarely static.
- Software Development: Coding, testing, and deployment cycles.
- Platform Management: Maintaining server infrastructure and ensuring uptime.
- Community Building: Engaging with developers or users to foster adoption.
- Research and Development: Innovating to stay ahead of competitors.
It is important to distinguish between core activities and supporting activities. If your product relies on AI, Machine Learning research is a core activity. If you are an integration platform, API management is core.
Q6: What are the Key Resources required to sustain a tech business? 🛠️
Resources are the assets required to offer and deliver a value proposition.
- Human Capital: Skilled developers, data scientists, and product managers. Talent retention is often the biggest risk.
- Intellectual Property: Patents, proprietary algorithms, and code repositories.
- Physical Infrastructure: Servers, data centers, or hardware if applicable.
- Financial Capital: Funding to support long development cycles before profitability.
For many digital products, the most critical resource is the team. Unlike a factory where machinery can be bought, a team of engineers takes years to build and cannot be easily replaced.
Q7: How do Partnerships influence the tech ecosystem? 🤝
No technology exists in a vacuum. Partnerships allow you to leverage external capabilities.
- Cloud Providers: AWS, Google Cloud, or Azure for hosting infrastructure.
- Integration Partners: Companies whose platforms your product connects with (e.g., Slack, Salesforce).
- Distribution Channels: Marketplaces or app stores that bring traffic.
- Strategic Alliances: Co-marketing or co-development agreements.
Partners can reduce your Key Activities. Instead of building your own payment gateway, you might partner with a payment processor. This allows you to focus on your core value proposition.
Q8: What constitutes the Cost Structure in a technology company? 💸
Understanding costs is essential for financial health. Tech costs often skew heavily towards fixed operational expenses rather than variable production costs.
- Personnel: Salaries for engineering and support staff are usually the largest expense.
- Infrastructure: Cloud hosting fees, domain costs, and security certificates.
- Customer Acquisition: Marketing spend, sales commissions, and advertising.
- Legal and Compliance: Data privacy audits, patent filings, and regulatory fees.
Many tech companies operate at a loss initially to gain market share. The Canvas helps visualize when you expect these costs to be covered by revenue.
Q9: How do you map Customer Relationships in a digital product? 📞
Customer relationships define how you interact with your customer segments throughout their journey.
- Automated Services: Self-service portals, chatbots, and documentation.
- Personal Assistance: Dedicated account managers for enterprise clients.
- Communities: Forums, user groups, and hackathons.
- Co-creation: Beta testing programs where users help shape the product.
In tech, the shift is often from personal assistance to automated services to maintain margins. However, high-value enterprise clients often require a hybrid approach.
Q10: What are the Common Pitfalls when using the Canvas for Tech? ⚠️
Even experienced teams make mistakes. Being aware of these prevents strategic drift.
- Ignoring the Cost Structure: Focusing only on features without calculating the cost of hosting and support.
- Vague Value Propositions: Claiming “better” without defining metrics.
- Overestimating Adoption: Assuming users will figure out complex tools without training.
- Static Planning: Treating the canvas as a one-time document rather than a weekly or monthly review tool.
Regular review cycles ensure that the model adapts to market feedback. If a feature is not driving value, it should be cut, regardless of engineering effort already spent.
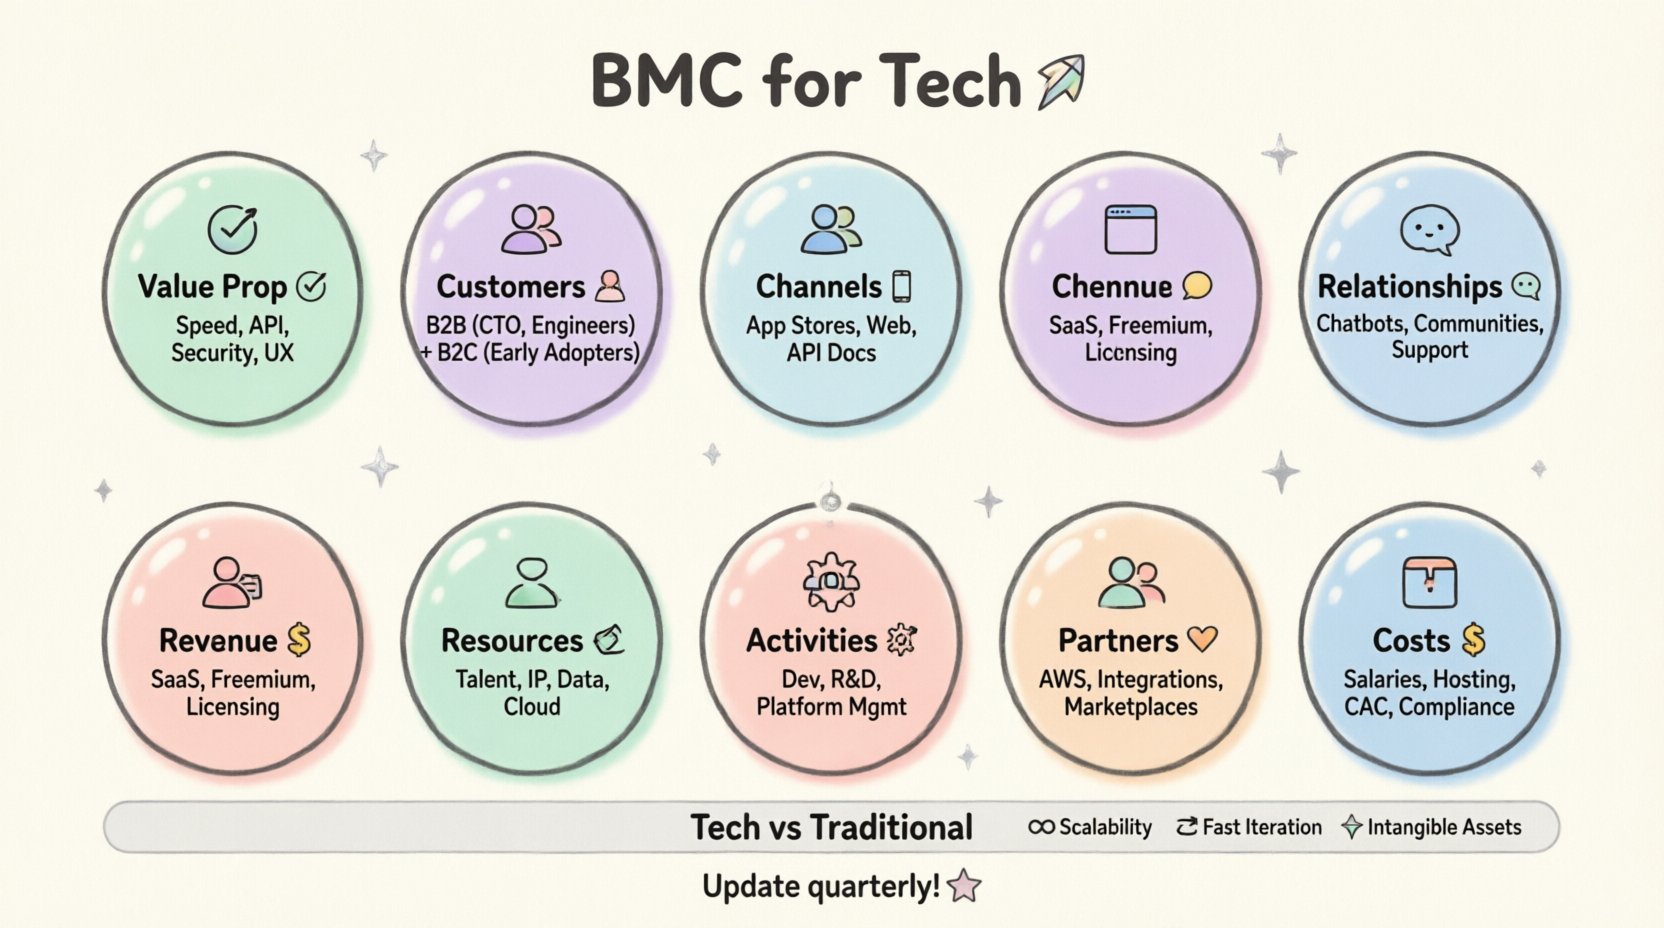
Summary Table: Tech-Specific Considerations
| Canvas Block | Traditional Business Focus | Tech Product Focus |
|---|---|---|
| Value Proposition | Physical quality, location | Speed, API, Security, UX |
| Customer Segments | Geographic demographics | User roles, technical literacy |
| Channels | Physical retail, direct sales | App stores, web, API docs |
| Key Resources | Machinery, inventory | Talent, IP, Data, Cloud |
| Cost Structure | COGS, Rent, Wages | Salaries, Cloud Hosting, R&D |
| Revenue Streams | One-time sales | Subscriptions, Licensing, Usage |
Q11: How does the canvas help with fundraising? 📈
Investors often ask for a clear view of how the business works. A completed Business Model Canvas provides a concise visual summary of your strategy.
- Clarity: It shows you understand where money comes from and where it goes.
- Alignment: It demonstrates that your product, market, and operations are aligned.
- Scalability: It highlights how the model handles growth without proportional cost increases.
While it is not a financial model, it complements financial projections by providing context for the assumptions behind the numbers.
Q12: Can the Canvas be used for internal innovation projects? 💡
Yes. Large organizations often use the Canvas to evaluate new internal tools or digital transformation initiatives.
- Feasibility Check: Does the internal team have the resources?
- Adoption Strategy: How will employees use this new tool?
- Efficiency: Will this reduce costs or improve speed?
Using the framework ensures that internal projects are treated as businesses, with clear value delivery and resource allocation.
Q13: What is the relationship between the BMC and Lean Startup methodology? 🔄
These two frameworks complement each other. The Business Model Canvas provides the hypothesis, while Lean Startup provides the testing method.
- Build-Measure-Learn: Use the BMC to define what you build. Use Lean to test assumptions about the Value Proposition and Customer Segments.
- Pivot or Persevere: If the canvas blocks do not align with market feedback, pivot the model.
- MVP: The Minimum Viable Product is built to test specific blocks of the canvas, such as Revenue or Channels.
Combining these approaches reduces risk by validating the business model before scaling development efforts.
Q14: How do you handle regulatory compliance in the Canvas? ⚖️
For tech products handling data (health, finance), compliance is a strategic constraint.
- Key Activities: Include compliance audits and security testing.
- Key Resources: Legal counsel and compliance officers.
- Cost Structure: Budget for certifications (SOC2, HIPAA, GDPR).
- Value Proposition: Compliance can be a selling point (trust).
Ignoring these factors can lead to shutdowns. They must be integrated into the strategic plan from the beginning.
Q15: How often should the Business Model Canvas be updated? 📅
In a fast-moving tech environment, annual updates are insufficient.
- Quarterly Reviews: Check high-level strategy and market fit.
- Monthly Sprints: Adjust Key Activities and Resources based on immediate progress.
- Event-Driven: Update immediately after major product launches, funding rounds, or market shifts.
Treat the canvas as a dynamic map, not a static destination. Changes in technology or regulation should trigger a review of the entire model.
Final Thoughts on Strategic Alignment 🎓
Building complex technology is a journey of continuous adjustment. The Business Model Canvas provides the necessary structure to navigate this complexity. By focusing on the specific nuances of tech products—such as infrastructure costs, technical talent, and digital distribution—you can create a sustainable path to growth.
Remember that the goal is not perfection on the first draft. The goal is clarity. Start with a hypothesis, test it with the market, and refine the model based on real data. This iterative process is the core of successful technology business management.
Use this framework to align your team, communicate with stakeholders, and make informed decisions. The tools you use are secondary to the logic you apply. Focus on the value you create and the customers you serve.