


Understanding how software components communicate over time is critical for robust system design. While static diagrams show structure, dynamic diagrams show behavior. Among the interaction diagrams in Unified Modeling Language (UML), the Interaction Overview Diagram (IOD) offers a unique perspective on complex workflows. This guide explores the mechanics, syntax, and application of Interaction Overview Diagrams for modeling system processes without relying on specific tools.
🧐 What is an Interaction Overview Diagram?
An Interaction Overview Diagram is a type of activity diagram that incorporates interaction diagrams. It provides a high-level view of the control flow between interactions. Think of it as a roadmap for a journey, where the “stops” are detailed conversations or sequences between objects, rather than just simple tasks. It combines the control flow logic of activity diagrams with the object interactions of sequence diagrams.
This diagram type is particularly useful when a process is too complex to show entirely in a single Sequence Diagram. Instead of one massive, tangled web of lifelines, you break the process down into logical sections (fragments) and link them together using control nodes. This modular approach keeps the visualization clean and manageable.
🔍 Key Characteristics
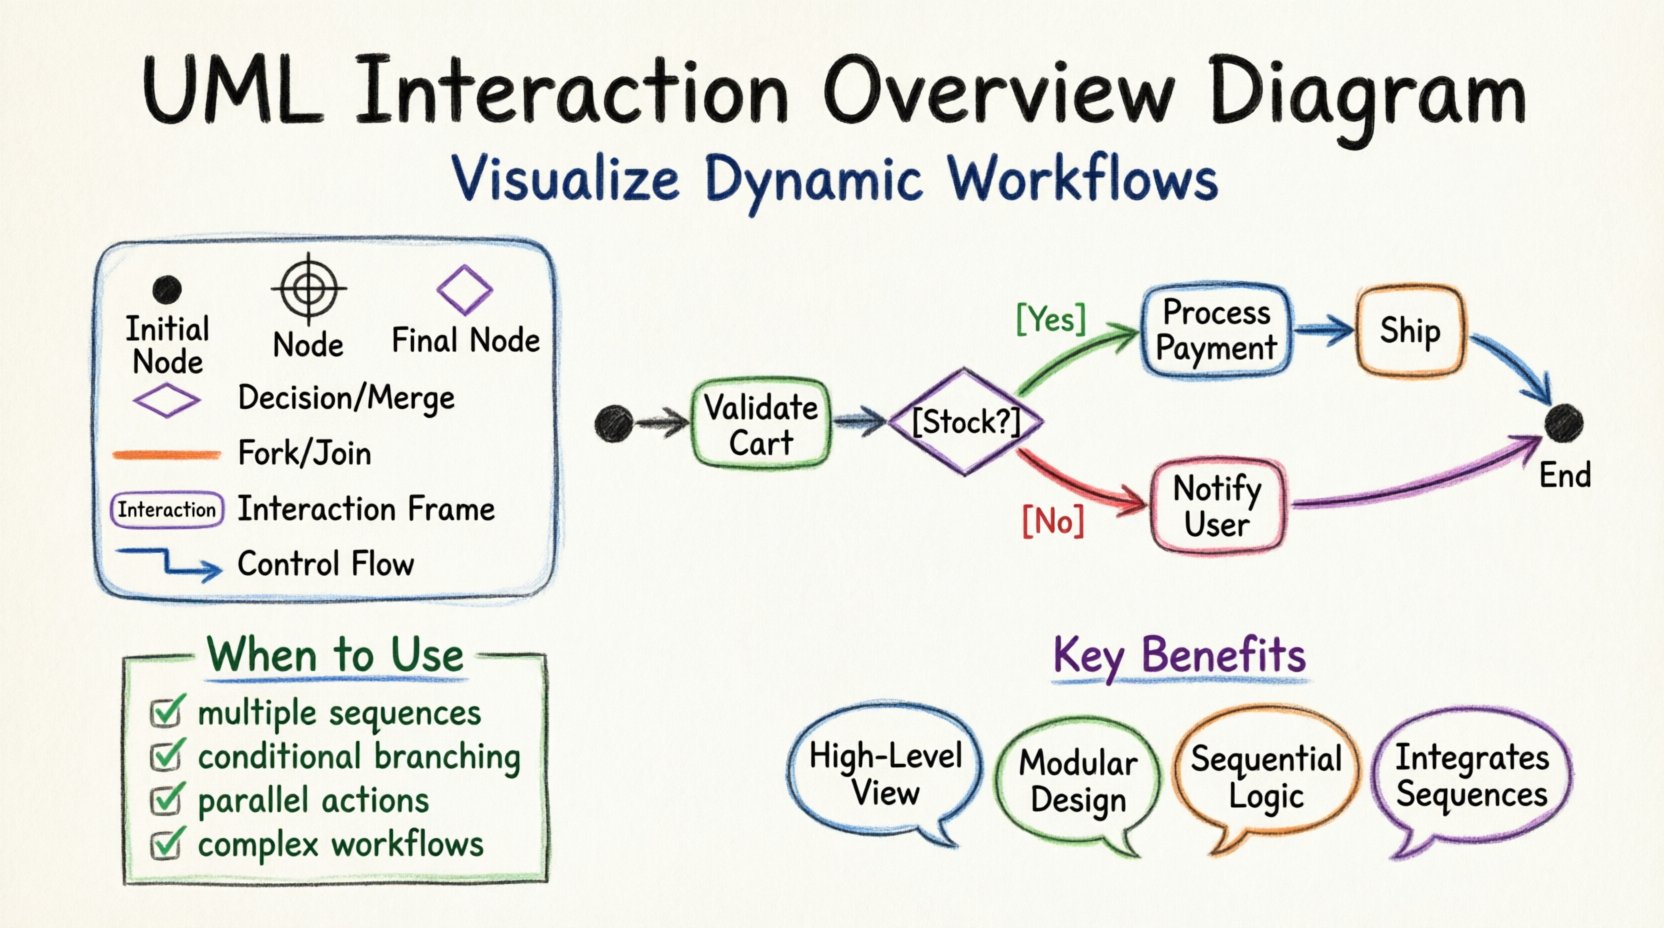
- High-Level View: It focuses on the flow of control rather than individual message exchanges.
- Modular: It encapsulates complex interactions into smaller, reusable chunks.
- Sequential Logic: It clearly depicts the order of operations, including loops and branches.
- Integration: It references other interaction diagrams, such as Sequence or Communication diagrams.
🛠️ Core Components and Notation
To create a valid Interaction Overview Diagram, one must understand the standard UML notation used for nodes and edges. The syntax is consistent with Activity Diagrams but applied to interaction contexts.
🟢 Control Nodes
Control nodes dictate the flow of the diagram. They determine when and how the process moves from one interaction to another.
- Initial Node: A solid black circle. This marks the starting point of the workflow. Every valid IOD must have exactly one initial node.
- Final Node: A solid black circle inside a larger black circle. This marks the end of the workflow. There can be multiple final nodes if the process can end in different states.
- Decision Node: A diamond shape. It represents a point where the flow branches based on a condition (e.g., true/false, success/failure). It has one incoming edge and multiple outgoing edges, each labeled with a guard condition in square brackets.
- Merge Node: A diamond shape. It combines multiple incoming flows into a single outgoing flow. It is the opposite of a decision node.
- Fork Node: A thick horizontal or vertical bar. It splits a single incoming flow into multiple concurrent flows. This allows parallel processing or simultaneous interactions.
- Join Node: A thick horizontal or vertical bar. It waits for all incoming concurrent flows to complete before proceeding. It ensures synchronization.
🔵 Interaction Nodes
These are the core elements that represent the actual interactions. In an IOD, these are not drawn as full sequence diagrams but are represented as specific nodes.
- Interaction Frame: A rectangle with the title “Interaction” in the upper left corner. Inside this frame, you can place a Sequence Diagram or Communication Diagram. This encapsulates the details of that specific step.
- Call Behavior Action: A rectangle with the name of the behavior or interaction. This node triggers a specific interaction sequence.
🔗 Edges and Flows
Edges connect the nodes and indicate the direction of the workflow.
- Control Flow: A solid line with an open arrowhead. This is the standard connector used in Activity and Interaction Overview diagrams to show the order of execution.
- Object Flow: A dashed line with an open arrowhead. This shows the movement of data or objects between nodes, though it is less common in pure interaction overviews compared to control flow.
⚖️ Comparison with Other UML Diagrams
Choosing the right diagram is essential for effective communication. Here is how the Interaction Overview Diagram compares to other common modeling tools.
| Diagram Type | Primary Focus | Best Used For | Complexity Level |
|---|---|---|---|
| Sequence Diagram | Time-ordered message flow between objects | Simple, linear interactions with detailed timing | Low to Medium |
| Activity Diagram | Business logic and procedural workflow | Algorithms, data processing, and business rules | Medium to High |
| Interaction Overview Diagram | Control flow between complex interactions | Orchestrating multiple sequence diagrams in a workflow | High |
| State Machine Diagram | States and transitions of a single object | Lifecycle management and object behavior | Medium |
💡 When to Use an IOD
You should consider using an Interaction Overview Diagram when:
- ✅ The workflow involves multiple distinct sequences of events.
- ✅ The logic includes conditional branching (if/else) between major steps.
- ✅ The process requires parallel actions that must synchronize later.
- ✅ A single Sequence Diagram becomes too crowded or unreadable.
- ✅ You need to model the overall control flow while delegating detail to other diagrams.
📐 Building an Interaction Overview Diagram: Step-by-Step
Creating a clear and accurate diagram requires a structured approach. Follow these steps to model your dynamic workflows effectively.
Step 1: Define the Scope and Entry Point
Start by identifying the trigger for the workflow. Is it a user login? An API request? Place the Initial Node (solid black circle) at the top or left of your canvas. Clearly label the starting condition.
Step 2: Identify Major Interaction Stages
Break down the process into major phases. Instead of drawing every message, identify the key milestones. For example, in an e-commerce checkout, the stages might be “Validate Cart”, “Process Payment”, and “Generate Invoice”. Represent each stage as an Interaction Frame.
Step 3: Connect with Control Flow
Draw arrows between the stages to show the default sequence. If the flow is linear, connect the final node of one interaction to the initial node of the next. Use standard control flow arrows.
Step 4: Add Decision Logic
Introduce Decision Nodes where the outcome might change the path. For instance, after “Validate Cart”, a decision node might check if the stock is sufficient. Label the outgoing edges with conditions like “[Stock Available]” or “[Insufficient Stock]”.
Step 5: Handle Parallelism
If two actions happen simultaneously, use a Fork Node to split the path. Ensure you have a corresponding Join Node later to synchronize the results before proceeding. This is common in scenarios where notifications and logging occur at the same time.
Step 6: Define End States
Determine where the process terminates. Use Final Nodes to mark success or failure points. A process might end successfully, or it might end in an error state. Distinguish these clearly.
🌐 Real-World Use Cases
To understand the practical application, let us look at a few scenarios where this diagram type adds value.
🛒 E-Commerce Order Processing
This is a classic use case. The workflow starts with a user placing an order. The IOD manages the flow between checking inventory, processing payment, and handling shipping.
- Start: User submits order.
- Interaction 1: Check Inventory (Sequence Diagram inside frame).
- Decision: Is stock available?
- Path A: Process Payment. If success, ship item. If fail, notify user.
- Path B: Notify user of delay.
- End: Order completed or cancelled.
🔐 User Authentication Flow
Security flows often involve multiple verification steps that can branch based on credentials.
- Start: Login attempt.
- Interaction: Verify Credentials.
- Decision: Valid credentials?
- Path A: Generate Token (Interaction).
- Path B: Check Two-Factor Authentication (Interaction).
- End: Session Created or Access Denied.
🤖 API Gateway Routing
In microservices architecture, a gateway often routes requests to different backend services based on headers or payload content.
- Start: Incoming Request.
- Decision: Request Type?
- Fork: Log Request AND Validate Token.
- Join: Both complete.
- Decision: Token Valid?
- Interaction: Route to Service A or Service B.
🚧 Common Mistakes and Pitfalls
Even experienced modelers can fall into traps when creating Interaction Overview Diagrams. Avoid these common errors to maintain clarity.
- Over-Complexity: Do not try to draw every single message inside the IOD. Keep the IOD high-level. Use the Sequence Diagrams for the details.
- Missing Guards: Decision nodes must have labeled edges. An unlabeled diamond confuses the reader about which path to take.
- Unbalanced Forks and Joins: If you split the flow into two paths, you must join them back together before proceeding, unless the paths are mutually exclusive and lead to different ends.
- Inconsistent Notation: Stick to standard UML shapes. Do not invent custom symbols that only your team understands.
- Ignoring Error Paths: Focus only on the “Happy Path” (success scenario). Real systems handle failures. Include decision nodes for error handling.
- Circular Dependencies: Ensure loops are clear. Avoid logic that creates an infinite loop without an exit condition.
📊 Best Practices for Clarity
To ensure your diagrams are effective communication tools, adhere to these guidelines.
🎯 Keep It Simple
If a diagram becomes too dense, split it into sub-diagrams. An IOD should act as a table of contents for your interactions, not the detailed text of the book.
🏷️ Label Everything
Clear labels are non-negotiable. Every node, every edge, and every guard condition should be descriptive. Use verbs for actions (e.g., “Validate”, “Send”) and nouns for objects.
🔄 Reuse Interaction Frames
If the same sequence of interactions happens in multiple places, define the Interaction Frame once and reference it. This reduces redundancy and makes updates easier.
🖊️ Maintain Consistency
Use the same notation style across all diagrams in your project. If you use rounded rectangles for activities in Activity Diagrams, use them consistently in IODs.
📅 Version Control
Just like code, models change. Ensure your diagram files are versioned. Document why changes were made, especially when the control flow logic shifts.
🧩 Integrating with Other Diagrams
An Interaction Overview Diagram rarely exists in isolation. It is part of a larger modeling ecosystem.
- With Class Diagrams: The objects involved in the interactions should be defined in Class Diagrams. Ensure names match exactly.
- With State Machines: An IOD can show the flow of events that trigger state changes in objects modeled by State Machine Diagrams.
- With Use Case Diagrams: Use Case Diagrams describe *what* the system does. IODs describe *how* the system achieves those goals through interactions.
❓ Frequently Asked Questions
Q: Can I use an Interaction Overview Diagram for a simple process?
A: Yes, but it might be overkill. For simple, linear processes, a Sequence Diagram or even a flowchart is often sufficient. Use IOD when complexity demands separation of concerns.
Q: How do I represent exceptions in an IOD?
A: Use Decision Nodes. Create a path for “Success” and a path for “Error”. The Error path can lead to a logging interaction or a user notification interaction.
Q: Is an IOD the same as an Activity Diagram?
A: No. An Activity Diagram models the logic of actions. An IOD models the logic of *interactions* between objects. However, an IOD uses the same syntax as an Activity Diagram, just with Interaction Frames instead of simple Action Nodes.
Q: What if I need to show timing information?
A: IODs are not designed for precise timing. If timing is critical, refer to the Sequence Diagrams embedded within the Interaction Frames, or use a Timing Diagram.
Q: Can I nest Interaction Frames?
A: Technically possible, but strongly discouraged. Nesting makes the diagram hard to read. If you need that level of detail, create a separate top-level IOD and reference it.
📝 Final Thoughts on Workflow Visualization
Mastery of system modeling comes from knowing which tool fits the job. The Interaction Overview Diagram fills a specific niche: bridging the gap between high-level control flow and low-level message exchange. It allows architects to see the forest (the workflow) while still acknowledging the trees (the detailed interactions).
By adhering to standard notation and focusing on clarity over complexity, these diagrams become powerful documentation assets. They reduce ambiguity, guide development teams, and serve as a reference for testing scenarios. Whether you are designing a banking transaction system or a simple notification service, the principles of control flow remain the same.
Start small. Model a single workflow. Add a decision node. Introduce a parallel path. As your diagrams grow, so will your understanding of the system’s dynamic behavior. This visual language is a permanent asset in your technical toolkit, providing a clear path through the complexities of software architecture.