


Business processes often involve intricate sequences of events, conditional logic, and multiple actors collaborating to achieve a specific outcome. When these processes become too complex for a simple flowchart, a more robust modeling technique is required. The UML Interaction Overview Diagram (IOD) serves this purpose effectively. It combines elements of activity diagrams and sequence diagrams to provide a high-level view of interactions while allowing for detailed drill-downs where necessary.
This guide explores how to apply Interaction Overview Diagrams to map complex business workflows. We will walk through a realistic scenario, breaking down the modeling steps, analyzing the structure, and understanding the value this notation brings to system design.
🔍 Understanding the Interaction Overview Diagram
An Interaction Overview Diagram is a type of UML diagram that depicts the control flow from one interaction to another. It is essentially a high-level activity diagram where the nodes are interaction specifications. This allows modelers to focus on the flow of control and the exchange of messages between objects at a higher level of abstraction.
Key characteristics include:
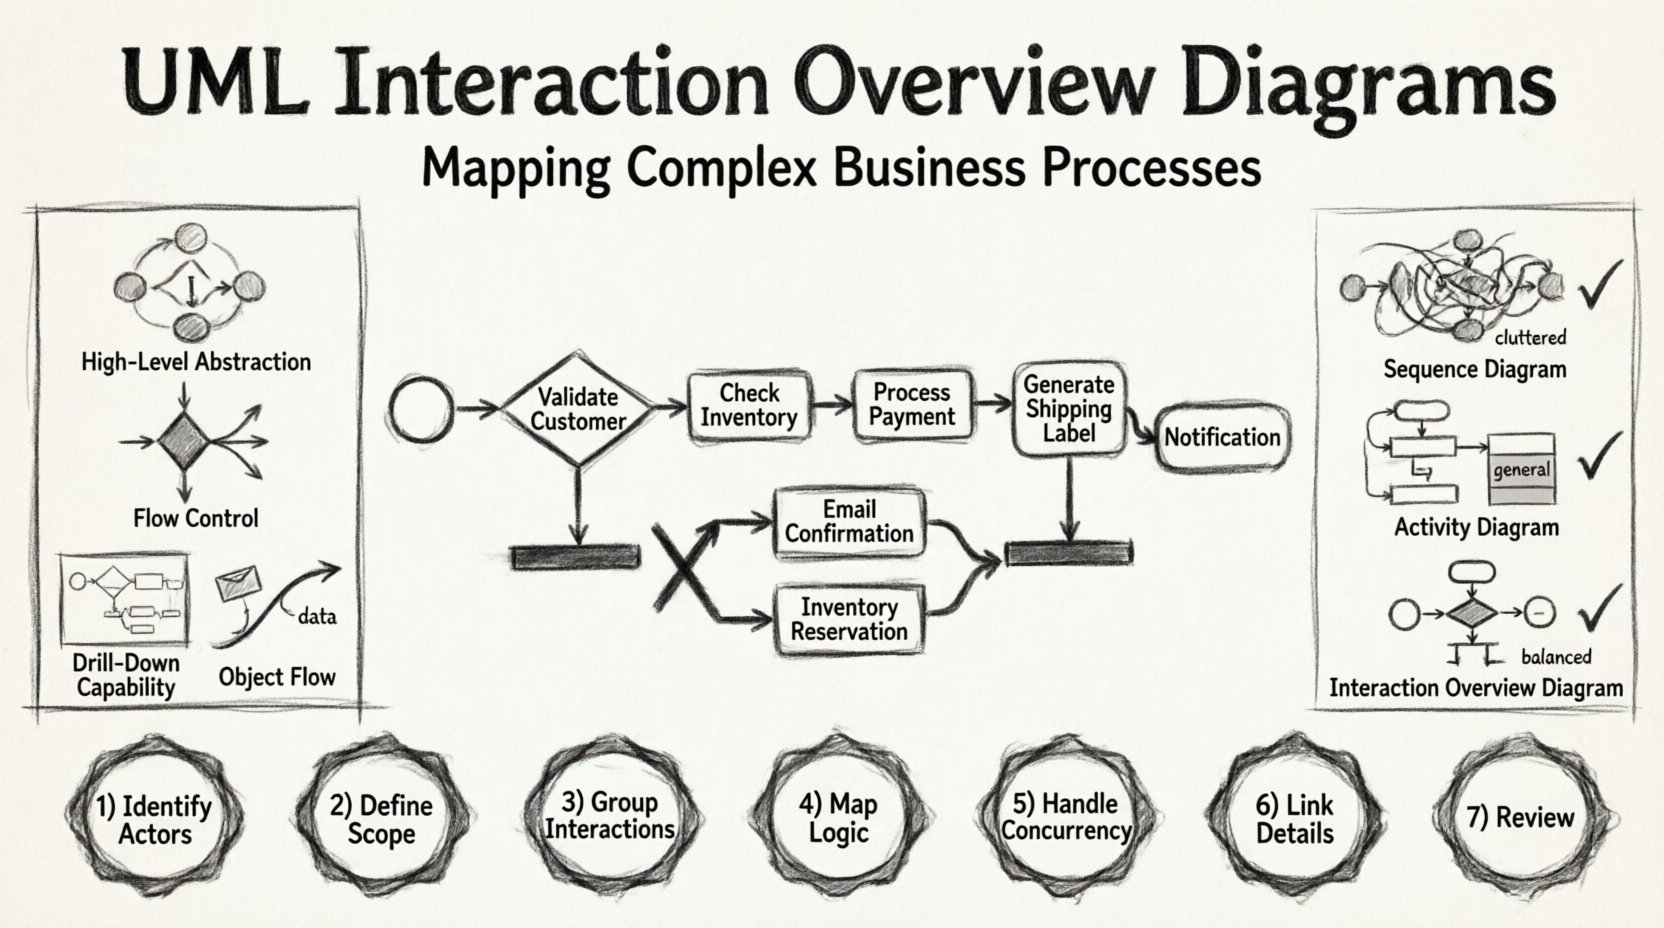
- High-Level Abstraction: It avoids the clutter of individual message exchanges found in Sequence Diagrams.
- Flow Control: It uses standard activity diagram constructs like decision nodes, forks, and joins.
- Drill-Down Capability: Each node can represent a sequence diagram or another interaction overview diagram.
- Object Flow: It tracks the flow of objects between interactions.
🏢 Case Study Context: Enterprise Order Fulfillment
To demonstrate the practical application, consider a complex Order Fulfillment System for an enterprise e-commerce platform. This process involves multiple departments, external vendors, and conditional logic based on inventory levels and payment status.
Scenario Overview:
- Trigger: A customer places an order via the web portal.
- Validation: System checks customer credit, address validity, and item availability.
- Inventory Check: Warehouse system confirms stock levels.
- Payment: Payment gateway processes the transaction.
- Shipping: Logistics team prepares and dispatches the package.
- Notification: Customer receives status updates.
Without a structured approach, the interactions between these steps can become a tangled web. An Interaction Overview Diagram provides the map.
🛠️ Step-by-Step Mapping Process
Creating the diagram requires a methodical approach. We will break down the mapping into logical phases.
1. Define the Start and End Points
Every diagram needs a clear entry and exit. For the Order Fulfillment process:
- Start Node: Represented by a solid circle. This signifies the arrival of the order event.
- End Node: Represented by a solid circle with a border. This signifies the completion of the fulfillment cycle or the cancellation of the order.
2. Model the Initial Interactions
Instead of drawing every message, we group related interactions into a single node. For example, the “Order Validation” phase involves the Web Frontend, the Order Service, and the Customer Database. This entire cluster becomes one interaction node in the overview.
Key Interaction Nodes:
- Validate Customer: Checks account status and credit limits.
- Check Inventory: Queries the Warehouse Management System.
- Process Payment: Communicates with the external Payment Gateway.
- Generate Shipping Label: Prepares data for the Logistics System.
3. Implement Control Flow Logic
Business rules dictate the path. We use decision nodes (diamonds) to represent these branches.
Example Logic:
- If Validate Customer returns Success, proceed to Check Inventory.
- If Validate Customer returns Failure, proceed to Notify Customer and end the process.
- If Check Inventory returns Low Stock, trigger a Backorder interaction.
- If Check Inventory returns Available, proceed to Process Payment.
This logic creates branches and merges, visualizing the decision tree clearly without cluttering the view with message arrows.
4. Handle Parallel Processes
Some steps happen simultaneously. For instance, after payment is confirmed, the system might send a confirmation email while simultaneously reserving the inventory in the warehouse. We use Fork and Join nodes to represent this concurrency.
- Fork Node: A thick horizontal bar indicating the splitting of the flow into parallel threads.
- Join Node: A thick horizontal bar indicating the merging of parallel threads back into a single flow.
📊 Comparison of Modeling Techniques
Choosing the right diagram type is critical for clarity. Below is a comparison of how different UML diagrams handle this specific business process.
| Diagram Type | Best Used For | Complexity Handling | Interaction Clarity |
|---|---|---|---|
| Sequence Diagram | Detail-oriented message exchanges between specific objects | Low (becomes unreadable with many branches) | High for specific interactions, Low for overall flow |
| Activity Diagram | General workflow and state transitions | High (good for complex logic) | Medium (does not explicitly show object interactions) |
| Interaction Overview Diagram | High-level flow with interaction details | High (manages complexity via abstraction) | High (shows flow between interaction specs) |
🧩 Integration with Sequence Diagrams
The true power of the Interaction Overview Diagram lies in its ability to reference Sequence Diagrams. In the case study, the “Process Payment” node in the overview can link to a detailed Sequence Diagram.
This detailed diagram would show:
- The exact order of messages (Request, Authorization, Response).
- The state of objects during the transaction.
- Exception handling paths specific to the payment gateway.
By using a Call Behavior Action on the Interaction Overview node, the modeler indicates that the detailed sequence logic exists elsewhere but is triggered here. This keeps the high-level diagram clean while maintaining access to deep technical details.
⚠️ Common Pitfalls to Avoid
When mapping complex business processes, certain errors frequently occur. Awareness of these pitfalls ensures the diagram remains useful.
- Over-Abstraction: Making nodes too generic. If a node represents a complex sub-process, ensure it is defined clearly or linked to a detailed diagram.
- Too Many Parallel Flows: Excessive forking can make the diagram visually chaotic. Group parallel activities where possible.
- Ignoring Object Flow: Interaction Overview Diagrams can show the flow of objects. Ignoring this can lead to confusion about data consistency between steps.
- Missing Error Paths: A diagram showing only the happy path is incomplete. Explicitly map failure scenarios, such as payment rejections or inventory shortages.
📈 Analyzing and Optimizing the Process
Once the diagram is complete, it serves as a tool for analysis. Stakeholders can review the flow to identify inefficiencies.
Identifying Bottlenecks
Look for nodes with high incoming and outgoing flow lines. These represent critical path items. In the Order Fulfillment case, the Process Payment node often becomes a bottleneck due to external dependencies.
Reducing Latency
Examine the Join nodes. If a Join waits for two parallel threads, and one thread is significantly slower, the entire process waits. This insight allows teams to optimize the slower thread or redesign the parallel structure.
Ensuring Compliance
For regulated industries, the diagram acts as documentation. It verifies that all required validation steps (e.g., KYC checks, tax calculations) are present in the logical flow.
🎯 Best Practices for Modeling
To maintain the quality of the documentation, adhere to these guidelines.
- Consistent Naming: Use clear, action-oriented names for interaction nodes (e.g., “Validate Stock” instead of “Stock Node”).
- Layered Detail: Use a top-level overview for management and lower-level IODs or Sequence Diagrams for developers.
- Standard Symbols: Stick to standard UML symbols for decision nodes, forks, and joins to avoid confusion.
- Regular Reviews: Business processes evolve. Schedule reviews to ensure the diagram matches the current system behavior.
🔄 Transitioning from Analysis to Design
The Interaction Overview Diagram is not just for documentation; it guides design. Developers use the diagram to understand the expected sequence of operations. When new features are added, the diagram is updated first, ensuring the code implementation aligns with the business intent.
For example, if a new “Express Shipping” option is introduced, the modeler adds a decision node after the Inventory Check. If the customer selects Express, the flow bypasses the standard warehousing queue and goes directly to the Logistics Dispatch. This visual update prevents logic errors during coding.
📝 Summary of Implementation Steps
Recap of the workflow for creating an effective Interaction Overview Diagram:
- Identify Actors: Determine who or what systems are involved.
- Define Scope: Set the start and end boundaries of the process.
- Group Interactions: Combine related message exchanges into single interaction nodes.
- Map Logic: Add decision nodes for business rules and conditions.
- Handle Concurrency: Use fork and join nodes for parallel tasks.
- Link Details: Connect nodes to detailed Sequence or Activity Diagrams.
- Review: Validate the flow against real-world scenarios.
🔗 Final Thoughts on Process Mapping
Complex business processes demand clear communication between stakeholders. The Interaction Overview Diagram bridges the gap between high-level business requirements and low-level system design. By abstracting the details into manageable nodes while retaining the logic of control flow, it enables teams to visualize the entire ecosystem without getting lost in the weeds.
When applied correctly, it reduces ambiguity, highlights integration points, and serves as a living document for the system architecture. Whether managing order fulfillment, loan approvals, or incident response, the structure provided by this notation ensures that every step of the process is accounted for and logically sound.