


In the landscape of software engineering, design documentation often becomes a casualty of tight deadlines and rapid development cycles. Teams frequently prioritize coding speed over architectural clarity, assuming that code comments and sequence diagrams suffice for understanding system behavior. However, this approach often leads to fragmented logic and misunderstood control flows. The Interaction Overview Diagram (IOD) is a critical artifact that bridges the gap between high-level activity flows and detailed object interactions. This guide explores why this specific UML element is a necessity for robust system design rather than an optional luxury.
Understanding the Interaction Overview Diagram 🧠
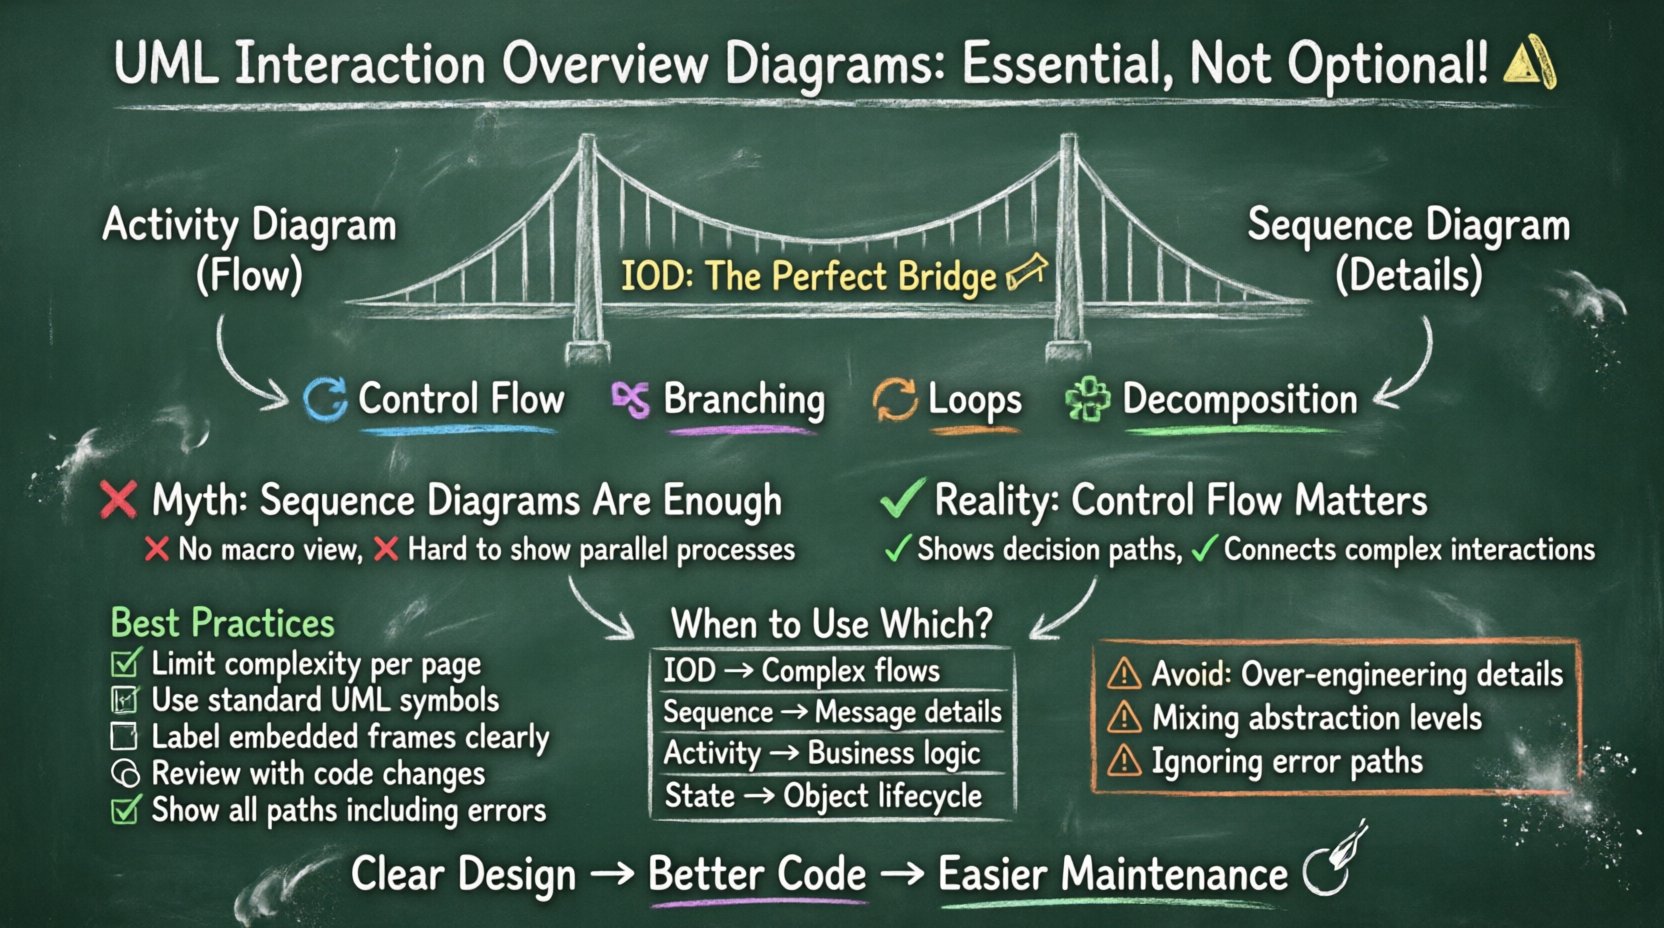
An Interaction Overview Diagram is a hybrid diagram type in the Unified Modeling Language (UML) standard. It combines the best features of Activity Diagrams and Sequence Diagrams. While Activity Diagrams show the flow of control and data, and Sequence Diagrams focus on the timeline of object interactions, the IOD sits in the middle. It allows architects to visualize the overall flow of interactions within a system while delegating specific complex interactions to embedded Sequence Diagrams.
This structure is particularly useful for complex systems where a single sequence diagram would become too cluttered to read. By breaking down a large process into smaller interaction frames, the IOD provides a navigable map of the system’s logic. It is not merely a drawing; it is a specification of how different parts of the system coordinate to achieve a specific business goal.
- Control Flow: It defines the order in which interactions occur.
- Branching: It handles conditional logic (if-else scenarios).
- Loops: It represents iterative processes clearly.
- Decomposition: It breaks complex interactions into manageable frames.
Without this abstraction layer, developers are left to piece together the narrative from scattered sequence diagrams. The IOD provides the narrative structure, ensuring that the individual interactions make sense within the broader context of the application.
The Myth: “Sequence Diagrams Are Enough” 🚫
A common misconception in software design is that detailed Sequence Diagrams provide sufficient context for the entire system. While Sequence Diagrams are excellent for examining specific message exchanges between objects, they suffer from a lack of macroscopic view. They are essentially linear snapshots of time. When a system involves multiple parallel processes, conditional branches, or error handling paths, a single sequence diagram cannot represent the decision tree effectively.
Teams often argue that adding an IOD doubles the documentation effort. This view underestimates the cost of ambiguity. If the control flow is not documented at a high level, developers may implement logic that fits a specific sequence but violates the overall process logic. The IOD forces the design team to consider the “big picture” before diving into the object-level details.
Consider the following scenarios where relying solely on Sequence Diagrams creates friction:
- Parallel Processing: Sequence diagrams are sequential by nature. Representing concurrent activities requires multiple diagrams without a clear way to show they happen simultaneously.
- Complex Error Handling: Exception paths often get lost in the details of a long sequence.
- State Changes: While state diagrams exist, the IOD shows how state changes trigger subsequent interactions across different components.
- Onboarding New Developers: New team members struggle to trace the flow of logic across multiple sequence diagrams.
The Reality: Control Flow Matters 🔄
The primary value of the Interaction Overview Diagram lies in its ability to model control flow. Software is not just about objects talking to each other; it is about the sequence of decisions that dictate *which* objects talk to *whom*. The IOD acts as a flowchart for interactions.
When designing a transaction processing system, for instance, the logic might involve checking inventory, validating payment, reserving stock, and generating a receipt. Each of these steps might involve complex internal object interactions. A Sequence Diagram would detail the payment validation. Another would detail the inventory check. The IOD connects these two diagrams, showing that the inventory check happens before the payment validation, and that the receipt generation only occurs if both succeed.
This hierarchical view prevents logic errors that are difficult to debug later. If the control flow is incorrect, the individual interactions, no matter how well-defined, will result in a broken system. The IOD ensures that the path through the system is logical and complete.
Bridging Activity and Sequence Models 🔗
One of the most powerful aspects of the IOD is its role as a bridge. In many projects, architects use Activity Diagrams for business processes and Sequence Diagrams for technical implementation. These two artifacts often diverge. The business process might look clean, but the technical implementation adds complexity that the business process does not reflect.
The Interaction Overview Diagram reconciles these two views. It allows the architect to use Activity Diagram nodes to represent high-level steps, but then embed a Sequence Diagram inside those nodes to show the technical reality. This ensures that the technical implementation remains faithful to the business process while acknowledging the complexity of the code.
This integration reduces the cognitive load on the development team. Instead of mentally translating between a business flow diagram and a technical interaction diagram, they have a single artifact that represents both. It aligns the technical team with the business requirements without losing technical precision.
Facilitating Stakeholder Communication 🗣️
Documentation serves multiple audiences, including business stakeholders, project managers, and developers. Sequence Diagrams are often too technical for non-technical stakeholders. They focus on lifelines and messages, which can be abstract to someone outside of engineering.
The Interaction Overview Diagram offers a more accessible view. It resembles a flowchart, which is a concept familiar to almost everyone. It shows the steps of a process without getting bogged down in the specific object names involved in each step. This makes it an excellent tool for reviews and sign-offs.
- Clarity: Stakeholders can see the high-level flow without understanding object-oriented specifics.
- Validation: Business logic can be verified against the diagram before coding begins.
- Scope Definition: It helps identify boundaries of the system more clearly than a list of messages.
When stakeholders understand the flow, they can provide better feedback. They can point out missing steps or incorrect logic branches early in the process. This early detection is far cheaper than fixing logic errors after the code is deployed.
Comparison: When to Use Which Diagram 📊
Confusion often arises regarding which diagram to use for which purpose. While the IOD is essential for complex interactions, it is not a replacement for every other diagram. Understanding the specific strengths of each diagram type ensures that the documentation set is efficient and effective.
| Diagram Type | Primary Focus | Best Used For |
|---|---|---|
| Interaction Overview | Control Flow of Interactions | Complex processes with branching and loops involving multiple sequences |
| Sequence | Time-ordered Message Exchange | Detailing specific object interactions within a single scenario |
| Activity | Business Logic Flow | High-level workflow without object-level detail |
| State Machine | Object Lifecycle | Tracking object states over time and triggers |
Using the wrong diagram type can lead to documentation that is either too dense or too vague. The IOD fills the gap where the Activity Diagram is too abstract and the Sequence Diagram is too detailed.
Best Practices for Implementation 🛠️
Creating an Interaction Overview Diagram requires discipline. Poorly constructed diagrams can become just as confusing as the code they are meant to clarify. Adhering to specific best practices ensures the diagram remains a useful tool throughout the project lifecycle.
- Limit Complexity: Do not try to map the entire system on one page. Break the system down into modules or features. Each feature should have its own IOD.
- Consistent Notation: Use standard UML symbols for decisions, forks, and joins. Consistency allows team members to read the diagram without a legend.
- Frame Clarity: When embedding Sequence Diagrams, label the frames clearly. The frame should indicate the specific interaction being detailed.
- Review Regularly: Diagrams become outdated as code changes. Schedule reviews during sprint planning or architecture meetings to ensure the diagram matches the current implementation.
- Focus on Flow: Ensure that every path leads to a termination point. Orphaned branches indicate logic errors in the design.
By following these guidelines, the diagram remains a living document that supports development rather than becoming a relic of the past.
Common Pitfalls to Avoid ⚠️
Even with good intentions, teams often stumble when introducing Interaction Overview Diagrams into their workflow. Recognizing these pitfalls early can save significant time and effort.
Over-Engineering
It is easy to create diagrams that are too detailed. If the IOD contains as much detail as a Sequence Diagram, it defeats the purpose of abstraction. The IOD should show the flow, not the messages. If you find yourself drawing lifelines inside the IOD, you are likely duplicating the Sequence Diagram.
Inconsistent Abstraction Levels
One common error is mixing high-level business steps with low-level technical calls in the same flow. This confuses the reader. Keep the IOD at the process level and move to the Sequence level for the technical specifics. Do not mix the two layers of abstraction.
Neglecting Error Paths
Many diagrams only show the “happy path”—the scenario where everything works perfectly. This is dangerous. The IOD should explicitly show error handling, retries, and fallback mechanisms. If the system fails, what is the next step? This information is crucial for robust system design.
Long-term Maintenance Benefits 📈
The value of the Interaction Overview Diagram extends well beyond the initial design phase. Software systems evolve. Requirements change, and features are added. Without a clear map of the interaction logic, refactoring becomes a risky endeavor.
When a developer needs to modify a specific feature, the IOD provides the context of how that feature interacts with the rest of the system. It helps identify side effects. If a change is made to the payment validation process, the IOD shows which downstream processes depend on that validation. This prevents regressions and unintended consequences.
Furthermore, for audit and compliance purposes, having a clear record of the control flow is often required. Regulatory standards may demand evidence of how data flows through the system and how decisions are made. The IOD serves as a valid artifact for these audits, demonstrating that the system logic was thoughtfully designed and documented.
Investing in this documentation pays dividends over the lifespan of the project. It reduces the time required for code reviews, facilitates knowledge transfer, and lowers the risk of introducing bugs during updates.
Conclusion: A Strategic Necessity 🏁
The decision to use Interaction Overview Diagrams should not be viewed as an administrative burden. It is a strategic investment in the quality and maintainability of the software. By clarifying control flow, bridging the gap between business and technical views, and facilitating communication, these diagrams provide a foundation for stable development.
Teams that skip this step often find themselves spending more time debugging logic errors and explaining system behavior than they would have spent creating the diagram in the first place. The complexity of modern systems demands clarity. The Interaction Overview Diagram offers that clarity.
Adopting this practice requires a shift in mindset from viewing documentation as a checkbox to viewing it as a core component of the engineering process. When the design is clear, the code follows naturally. When the design is ambiguous, the code suffers. Choose clarity. Choose the Interaction Overview Diagram.