


In the modern business landscape, customer experience is no longer a soft metric relegated to the marketing department. It is a hard financial driver. Organizations that understand the mechanics of customer interaction see measurable shifts in their bottom line. This guide examines the direct link between journey mapping and revenue, moving beyond abstract concepts to practical financial alignment.
Customer journey mapping is the visualization of the end-to-end process a client undergoes while engaging with a brand. It is not merely a diagram; it is a strategic tool that exposes the friction points where potential value evaporates. When executed with precision, this practice reveals where money is lost and how to capture it.
Revenue growth is often pursued through aggressive sales tactics or price adjustments. However, optimizing the path a customer takes to purchase often yields higher returns with less risk. This article details the mechanisms connecting experience design to financial outcomes.
Why Customer Experience Equals Financial Performance 🏦
The relationship between experience and revenue is rooted in human psychology and economic behavior. Customers do not purchase products in isolation; they purchase solutions to problems within a specific context. The context is the journey.
- Retention Costs: Acquiring a new customer costs significantly more than retaining an existing one. A mapped journey identifies where existing clients feel undervalued, allowing for interventions that reduce churn.
- Price Sensitivity: When the experience is seamless, customers demonstrate higher tolerance for price. Friction increases price sensitivity; smoothness decreases it.
- Advocacy: A positive journey transforms a customer into a promoter. Word-of-mouth marketing reduces acquisition costs, directly improving margins.
Financial performance is a lagging indicator of customer satisfaction. Journey mapping provides the leading indicators necessary to predict and influence future revenue.
Identifying Revenue Leakage Through Friction Points 🛑💸
Revenue leakage occurs when potential sales are lost due to obstacles in the customer path. These obstacles can be technical, emotional, or procedural. Mapping the journey highlights these leaks.
Consider a scenario where a client intends to purchase but encounters ambiguity during the checkout process. The friction here is not a lack of desire, but a lack of confidence or ease. Every second of hesitation represents a risk of abandonment.
| Friction Type | Example Scenario | Revenue Impact |
|---|---|---|
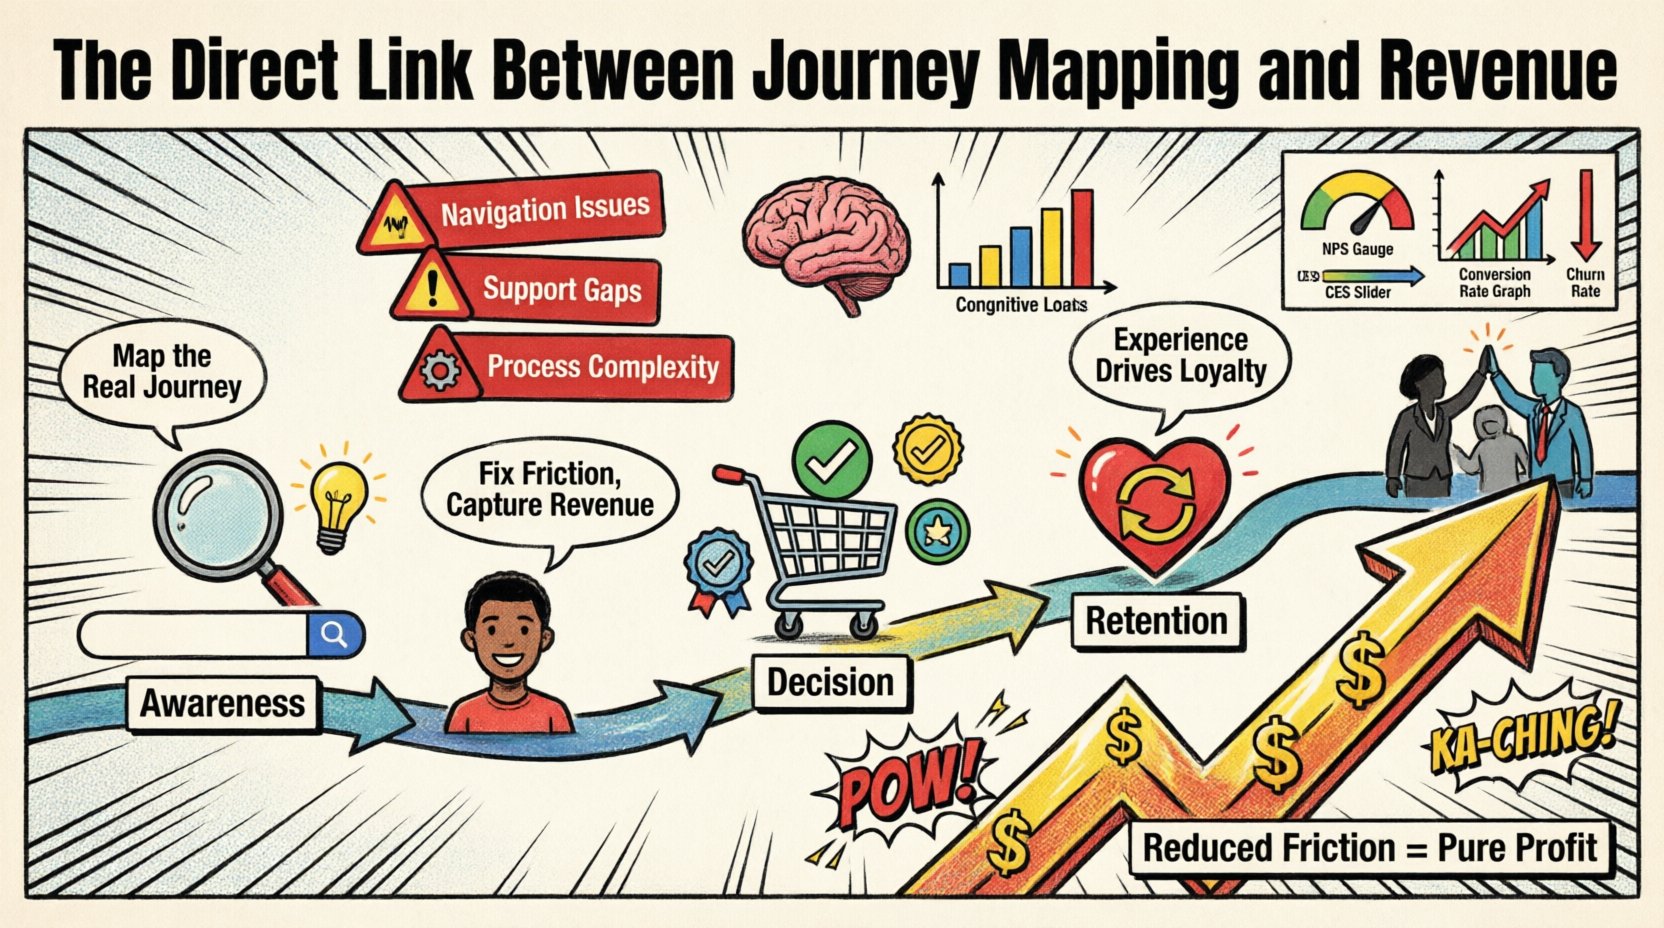
| Navigation Issues | Customer cannot find product specifications | Abandoned cart |
| Support Gaps | No clear answer to pricing questions | Lost conversion |
| Process Complexity | Excessive form fields during sign-up | Reduced adoption rate |
| Emotional Dissonance | Communication feels impersonal | Lower lifetime value |
Addressing these specific friction points removes the barriers between intent and transaction. The revenue recovered from these fixes is pure profit.
The Psychology Behind Purchase Decisions 🧠
Understanding the journey requires understanding the mind. Purchasing is an emotional decision justified by logic. The journey map must account for both.
- Cognitive Load: Every extra step a customer takes increases mental effort. High cognitive load leads to decision fatigue and abandonment. Simplifying the journey reduces this load.
- Trust Signals: Customers require reassurance at every stage. A journey map ensures trust signals (testimonials, security badges, clear policies) appear where anxiety is highest.
- Consistency: Inconsistent experiences create uncertainty. A mapped journey ensures the tone, message, and service level remain consistent across all touchpoints.
When the psychological needs of the customer are met, the barrier to spending lowers. The journey becomes a facilitator of the decision, rather than an obstacle.
Mapping the Path to Purchase: A Stage-by-Stage Breakdown 🗺️
A comprehensive journey map covers the entire lifecycle. Revenue is influenced at every stage, not just at the moment of transaction.
1. Awareness and Consideration
This stage is about visibility and credibility. Customers are searching for solutions. If the journey is unclear here, they leave before they ever become a lead.
- Goal: Capture attention and establish relevance.
- Revenue Action: Optimize content for search intent to reduce acquisition costs.
- Key Metric: Organic traffic and engagement rates.
2. Decision and Conversion
This is the critical moment where intent turns into action. The journey must be frictionless.
- Goal: Facilitate the transaction.
- Revenue Action: Remove technical barriers and clarify value propositions.
- Key Metric: Conversion rate and average order value.
3. Retention and Loyalty
The journey does not end at purchase. Post-purchase support determines if the revenue is one-time or recurring.
- Goal: Ensure satisfaction and encourage repeat business.
- Revenue Action: Identify upsell opportunities and reduce churn.
- Key Metric: Customer Lifetime Value (CLV) and Net Revenue Retention.
Measuring the Impact: Key Metrics That Matter 📊
Without measurement, there is no management. To link journey mapping to revenue, specific metrics must be tracked. These metrics bridge the gap between experience and finance.
| Metric | Definition | Link to Journey |
|---|---|---|
| Customer Effort Score (CES) | Ease of completing a task | Identifies friction in specific steps |
| Net Promoter Score (NPS) | Willingness to recommend | Measures emotional resonance of the journey |
| Churn Rate | Percentage of customers who stop using the service | Highlights failures in the retention phase |
| Conversion Rate | Percentage of visitors who become customers | Measures effectiveness of the decision stage |
Tracking these metrics over time allows organizations to see the correlation between journey improvements and financial results. A reduction in effort score should correlate with an increase in conversion rate.
Strategic Implementation Without Technology 🛠️
Building a journey map does not require expensive software. It requires cross-functional collaboration and a commitment to data.
- Define the Persona: Start with the customer. Who are they? What are their goals? What are their pain points?
- Gather Data: Use qualitative interviews and quantitative analytics. Combine what customers say with what they do.
- Map the Touchpoints: List every interaction. From the first ad click to the final invoice.
- Identify Emotions: At each touchpoint, ask: How does the customer feel? Frustrated? Confused? Delighted?
- Assign Ownership: Every stage needs an owner. Who is responsible for fixing the friction at this point?
- Test and Iterate: Treat the journey as a hypothesis. Make changes and measure the impact.
Collaboration is key. Sales, support, and product teams often hold different pieces of the puzzle. Bringing them together creates a holistic view of the financial impact of the customer experience.
Common Pitfalls That Drift Focus ⚠️
Even with the best intentions, organizations often misinterpret the data or misapply the strategy. Avoiding these common errors ensures the journey mapping effort translates to revenue.
- Focusing on the Ideal vs. The Real: Do not map how you want the process to work. Map how it actually works. The gap between the two is where the revenue leak exists.
- Ignoring Internal Friction: Sometimes the customer experience is blocked by internal processes. If a support agent cannot access data quickly, the customer suffers.
- Static Mapping: A journey map is a snapshot. Customer behaviors change. The map must be updated regularly to remain relevant.
- Isolating the Function: Do not let the CX team own the journey alone. The journey touches every department. Accountability must be shared.
Long-Term Value Over Short-Term Wins 🏆
The most significant financial benefit of journey mapping is the shift in perspective from transaction to relationship. Short-term sales tactics can boost revenue for a quarter but damage the brand long-term.
A mapped journey prioritizes the customer’s success. When the customer succeeds, the business succeeds. This alignment creates a sustainable revenue stream. It builds a foundation where growth is driven by value delivery rather than aggressive extraction.
Organizations that commit to this approach see a compounding effect. As the journey improves, trust grows. As trust grows, the cost of acquisition drops. As the cost of acquisition drops, margins expand.
Final Thoughts on Revenue Alignment
The connection between journey mapping and revenue is not theoretical; it is operational. It requires discipline to identify friction, courage to change processes, and consistency to maintain the improvements. When an organization treats the customer journey as a core financial asset, the results are inevitable. Revenue becomes a natural byproduct of a well-designed experience.
By focusing on the customer path, businesses do more than just fix broken steps. They build a system that supports sustainable growth. The investment in understanding the journey pays dividends in every financial report.