


In the digital landscape, user engagement is the currency of success. When visitors arrive at a website and leave immediately, it signals a disconnect. This metric, known as the bounce rate, is often the first indicator of friction in your user experience. However, treating it as a standalone number misses the bigger picture. The true driver of retention lies in understanding the path a user takes before they even land on your page. By implementing smarter journey mapping, you align your digital presence with user intent, significantly reducing premature exits and fostering deeper engagement.
This guide explores the mechanics of bounce rates, the strategic value of journey mapping, and how to integrate both to improve visitor retention. We will move beyond surface-level analytics to examine the behavioral and emotional layers that dictate user behavior. Through detailed analysis and actionable strategies, you can refine your digital touchpoints to meet expectations before the first click occurs.
Understanding Bounce Rate in Context 📊
A bounce occurs when a visitor lands on a page and exits without triggering a second request to the server. While often viewed negatively, context is critical. A high bounce rate on a contact page might be acceptable if the user found the phone number and called. Conversely, a high bounce rate on a landing page intended for lead generation suggests a failure in value proposition or technical performance.
To reduce bounce rates effectively, you must categorize the data. Not all bounces are equal. Consider the following classifications:
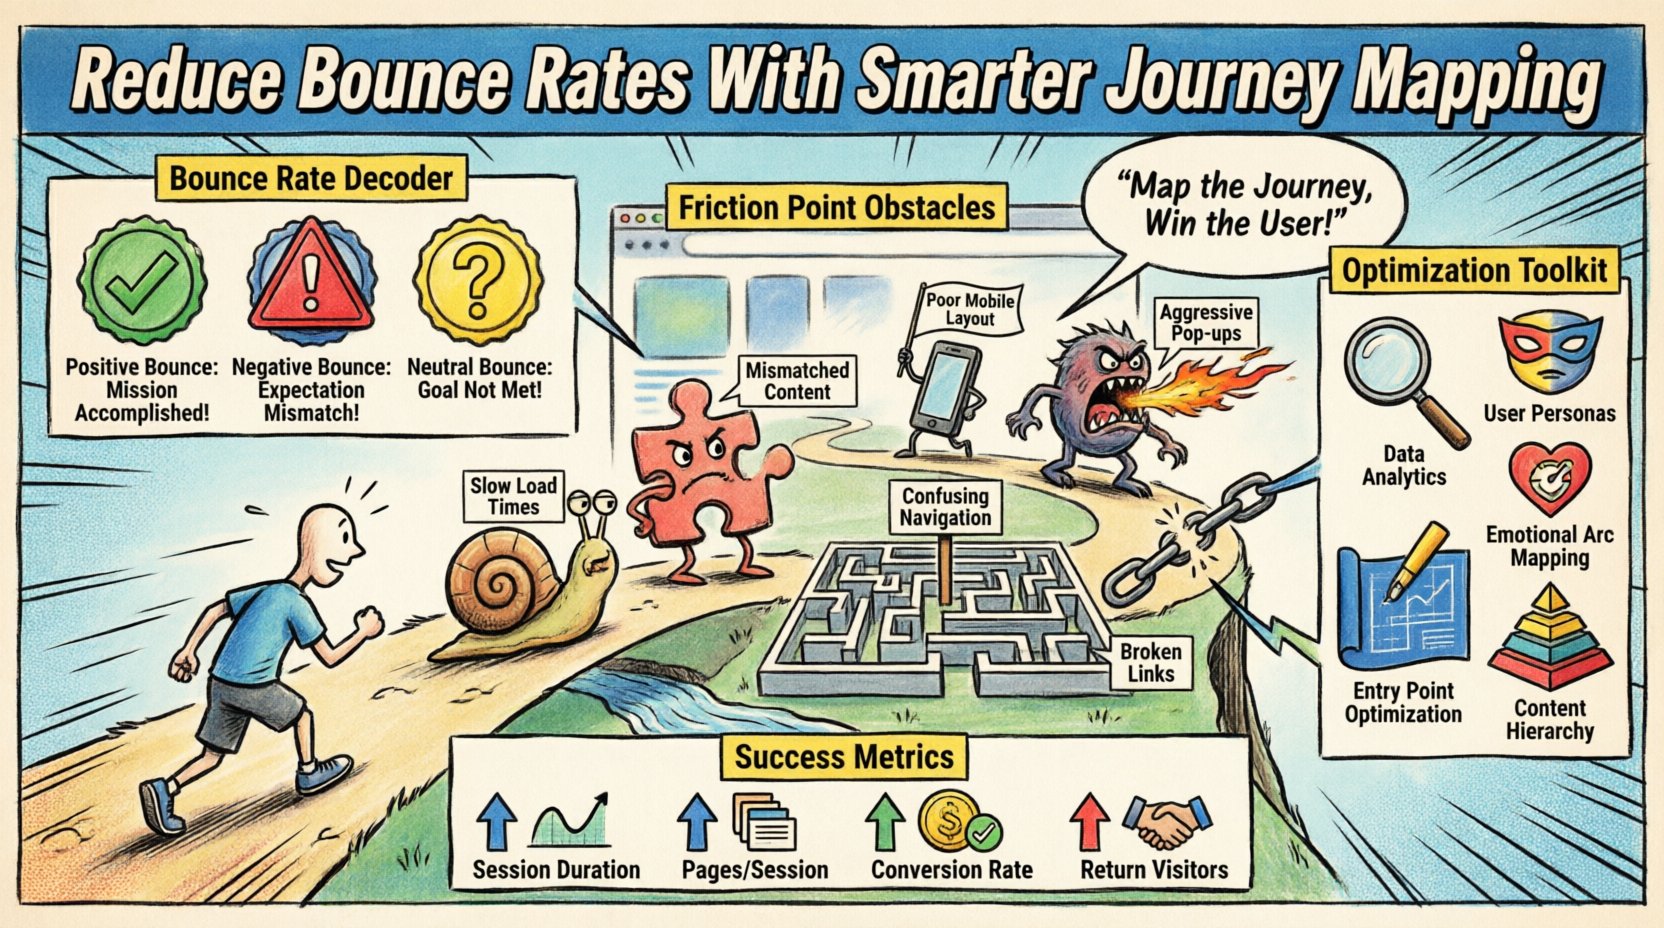
- Positive Bounce: The user found exactly what they needed on the entry page and left satisfied. This is common for blog posts or FAQ pages.
- Negative Bounce: The user arrived expecting one thing, found another, or encountered technical barriers, leading to an immediate exit.
- Neutral Bounce: The user explored the page but did not complete a specific goal, such as signing up or purchasing.
Focusing solely on lowering the overall percentage can lead to misguided optimizations. The goal is to reduce the negative bounce. This requires a shift from reactive analytics to proactive journey design.
The Intersection of Journey Mapping and User Retention 🔄
Customer journey mapping is the visualization of the end-to-end experience a user has with your brand. It includes every touchpoint, from the initial search query to the post-purchase support interaction. When applied to web analytics, journey mapping reveals the friction points that cause users to abandon a site.
Most organizations map journeys based on assumptions about what users want. This leads to gaps between expectation and reality. When a user clicks a search result, they have a specific mental model of the destination. If the landing page does not match that model, the bounce rate spikes.
Smarter journey mapping addresses this by integrating data from multiple sources:
- Search Intent: What keywords brought them here?
- Referral Source: Did they come from social media, email, or a direct link?
- Device Type: Are they on mobile, tablet, or desktop?
- Time of Day: Does engagement vary based on when they arrive?
By layering this data, you create a dynamic map that highlights where the user experience breaks down. This is the foundation for reducing bounce rates sustainably.
Identifying Friction Points: A Diagnostic Table 🔍
Before implementing changes, you must diagnose the specific causes of exit. The following table outlines common friction points found during journey mapping and their typical impact on bounce rates.
| Friction Point | Impact on Bounce Rate | Common Indicator |
|---|---|---|
| Slow Load Times | High | Core Web Vitals warnings |
| Mismatched Content | High | High exit rate on landing pages |
| Poor Mobile Layout | Medium-High | High mobile traffic, low engagement |
| Confusing Navigation | Medium | Low pages per session |
| Aggressive Pop-ups | High | Immediate exit after trigger |
| Broken Links | High | 404 errors in server logs |
Understanding these correlations allows you to prioritize fixes. For instance, if mobile load times are slow, optimizing images and code will have a more immediate impact than rewriting copy. Addressing technical performance removes the barrier that prevents the journey from starting.
Strategic Steps for Journey Optimization 🛠️
Reducing bounce rates requires a systematic approach. You cannot simply tweak one element and expect a transformation. The process involves research, design, testing, and iteration. Follow this structured workflow to align your journey mapping with user behavior.
1. Gather Qualitative and Quantitative Data
Data is the backbone of effective mapping. Relying on intuition often leads to errors. You need a mix of hard numbers and human feedback.
- Quantitative: Use analytics tools to track traffic sources, session duration, and exit rates. Look for patterns in the data that indicate where users are dropping off.
- Qualitative: Conduct user interviews or deploy surveys to ask visitors why they left. Heatmaps can show where users look and where they click, revealing areas of confusion.
Combining these datasets provides a holistic view. Numbers tell you where users leave; feedback tells you why.
2. Define Clear User Personas
Not all visitors are the same. A bounce rate might be high because you are serving content to the wrong audience. Creating detailed personas helps tailor the experience.
- Demographics: Age, location, and profession.
- Psychographics: Goals, pain points, and motivations.
- Behavioral Traits: Tech-savviness, device preference, and browsing habits.
When you map a journey for a specific persona, you can predict their needs more accurately. For example, a mobile-first persona expects quick access to information, while a research-heavy persona might prefer detailed comparisons. Aligning content with these expectations reduces friction.
3. Map the Emotional Arc
Users do not just consume information; they experience emotions. A journey map should track the emotional state of the user at each stage.
- Curiosity: The initial search phase.
- Frustration: Encountering slow load times or confusing layout.
- Satisfaction: Finding the answer or solution.
If the emotional arc is disrupted, the user leaves. For example, if a user lands on a page expecting a solution to a problem and sees only marketing fluff, frustration sets in immediately. This emotional gap is a primary driver of high bounce rates.
4. Optimize Entry Points
The landing page is the critical first step in the journey. It must validate the user’s decision to click. Ensure that the headline, subheadline, and visual hierarchy match the promise made in the search result or ad.
- Consistency: Ensure the message on the landing page mirrors the ad copy.
- Clarity: Make the value proposition clear within three seconds.
- Relevance: Remove distractions that do not serve the primary goal of the page.
5. Refine Content Hierarchy
Information architecture dictates how users navigate. If the most important information is buried, users will not find it and will leave. Use the inverted pyramid model for content.
- Headline: State the main benefit.
- Lead Paragraph: Expand on the benefit.
- Body: Provide supporting details and evidence.
- Call to Action: Guide the next step.
This structure respects the user’s time and attention. It reduces the cognitive load required to understand the page, thereby encouraging further exploration.
Technical Performance as a Journey Component 🚀
Even the best content cannot succeed if the technical foundation is weak. Performance is a direct component of the user journey. A slow page is a broken journey.
Optimization efforts should focus on the following areas:
- Server Response Time: Ensure your hosting environment can handle traffic spikes without lag.
- Image Optimization: Compress images to reduce file size without sacrificing quality.
- Caching: Implement browser caching to speed up repeat visits.
- Code Minification: Reduce the size of CSS and JavaScript files.
Monitoring these metrics regularly ensures that the journey remains smooth. A page that takes more than three seconds to load sees a significant drop in engagement. Prioritizing speed is not just a technical task; it is a user experience strategy.
Mobile Experience Considerations 📱
Mobile traffic now accounts for the majority of global web visits. Ignoring mobile optimization is a direct path to high bounce rates. The journey on a small screen differs significantly from a desktop experience.
Key considerations for mobile journey mapping include:
- Touch Targets: Buttons and links must be large enough to tap accurately.
- Readability: Font sizes should be legible without zooming.
- Navigation: Use a hamburger menu or bottom navigation bar to save screen real estate.
- Pop-ups: Avoid intrusive interstitials that block content immediately upon load.
A seamless mobile experience signals that you respect the user’s context. When users can navigate easily on their devices, they are more likely to stay and explore.
Aligning Content with Search Intent 🎯
Search intent is the primary reason users arrive at your site. If your content does not match that intent, the bounce rate will suffer. There are four main types of search intent:
- Informational: The user wants to learn something.
- Navigational: The user wants to find a specific page.
- Transactional: The user wants to buy something.
- Commercial Investigation: The user is comparing options.
For each intent, the journey must differ. An informational query requires a detailed article. A transactional query requires clear pricing and a buy button. Analyzing the keywords that drive traffic helps you tailor the page content to the specific expectation.
Measuring Success Beyond Bounce Rate 📈
While reducing bounce rate is a goal, it should not be the only metric. A lower bounce rate could also indicate confusion where users are clicking around aimlessly. Look at complementary metrics to gauge true engagement.
- Average Session Duration: Are users staying longer?
- Pages Per Session: Are they exploring deeper?
- Conversion Rate: Are they completing desired actions?
- Return Visitor Rate: Are they coming back?
Using a combination of these metrics provides a balanced view of performance. It ensures that you are not just keeping users on the page, but guiding them toward a meaningful outcome.
Continuous Improvement and Iteration 🔄
Journey mapping is not a one-time task. User behavior evolves, technology changes, and market conditions shift. Regular reviews of your journey maps are necessary to maintain effectiveness.
Establish a schedule for audits:
- Monthly: Review analytics for significant shifts in traffic patterns.
- Quarterly: Conduct user testing to validate current assumptions.
- Annually: Perform a comprehensive journey audit to reset baselines.
By maintaining a cycle of improvement, you ensure that your digital presence remains aligned with user needs. This proactive approach prevents small issues from becoming large barriers to engagement.
Final Thoughts on Journey and Retention 💡
Reducing bounce rates is about more than fixing a metric; it is about respecting the user’s time and intent. When you map the journey with care, you remove the friction that causes exits. You build a path that guides visitors naturally from curiosity to action.
The strategies outlined here require patience and discipline. There is no quick fix. However, the result is a website that serves its audience effectively. By prioritizing user needs over assumptions, you create a resilient digital environment capable of sustaining growth.
Start by auditing your current journey. Identify the friction points that cause the most exits. Implement changes incrementally and measure the impact. Over time, these small adjustments compound into significant improvements in engagement and retention. The journey never truly ends, but with the right map, every step leads toward success.