


Customer journey mapping is often visualized as a static diagram—a linear path from discovery to purchase. However, a map without data is merely a sketch. To truly understand how people interact with your brand, you must measure the friction, the flow, and the value at every touchpoint. Tracking the right metrics transforms abstract journey maps into actionable intelligence. This guide explores the specific indicators that reveal the truth about customer behavior without the noise.
Why Measurement Drives Understanding 🧠
Many organizations create journey maps based on assumptions. They assume a customer knows about the product, trusts the brand, and has a clear need. These assumptions fail when reality sets in. Metrics provide the evidence needed to validate or invalidate these assumptions. Without measurement, you are navigating blind.
When you track metrics correctly, you shift from guessing to knowing. You identify where customers drop off, where they spend the most time, and what triggers a purchase decision. This data-driven approach ensures that resources are allocated to the areas that actually impact the bottom line. It moves the conversation from “we think this is happening” to “the data shows this is happening.”
Key benefits of rigorous tracking include:
- Identification of Bottlenecks: Pinpoint exactly where the process stalls.
- Better Resource Allocation: Invest time and budget in high-performing stages.
- Improved Customer Experience: Remove friction points that cause frustration.
- Accurate Forecasting: Predict future revenue and churn rates based on historical data.
The Five Core Stages of the Journey 🗺️
To measure effectively, you must categorize metrics by the stage of the journey they represent. A metric that matters in the awareness stage may be irrelevant during retention. Aligning data with the lifecycle ensures relevance.
The standard lifecycle typically includes five distinct phases. Each phase has unique goals and requires specific indicators to track success.
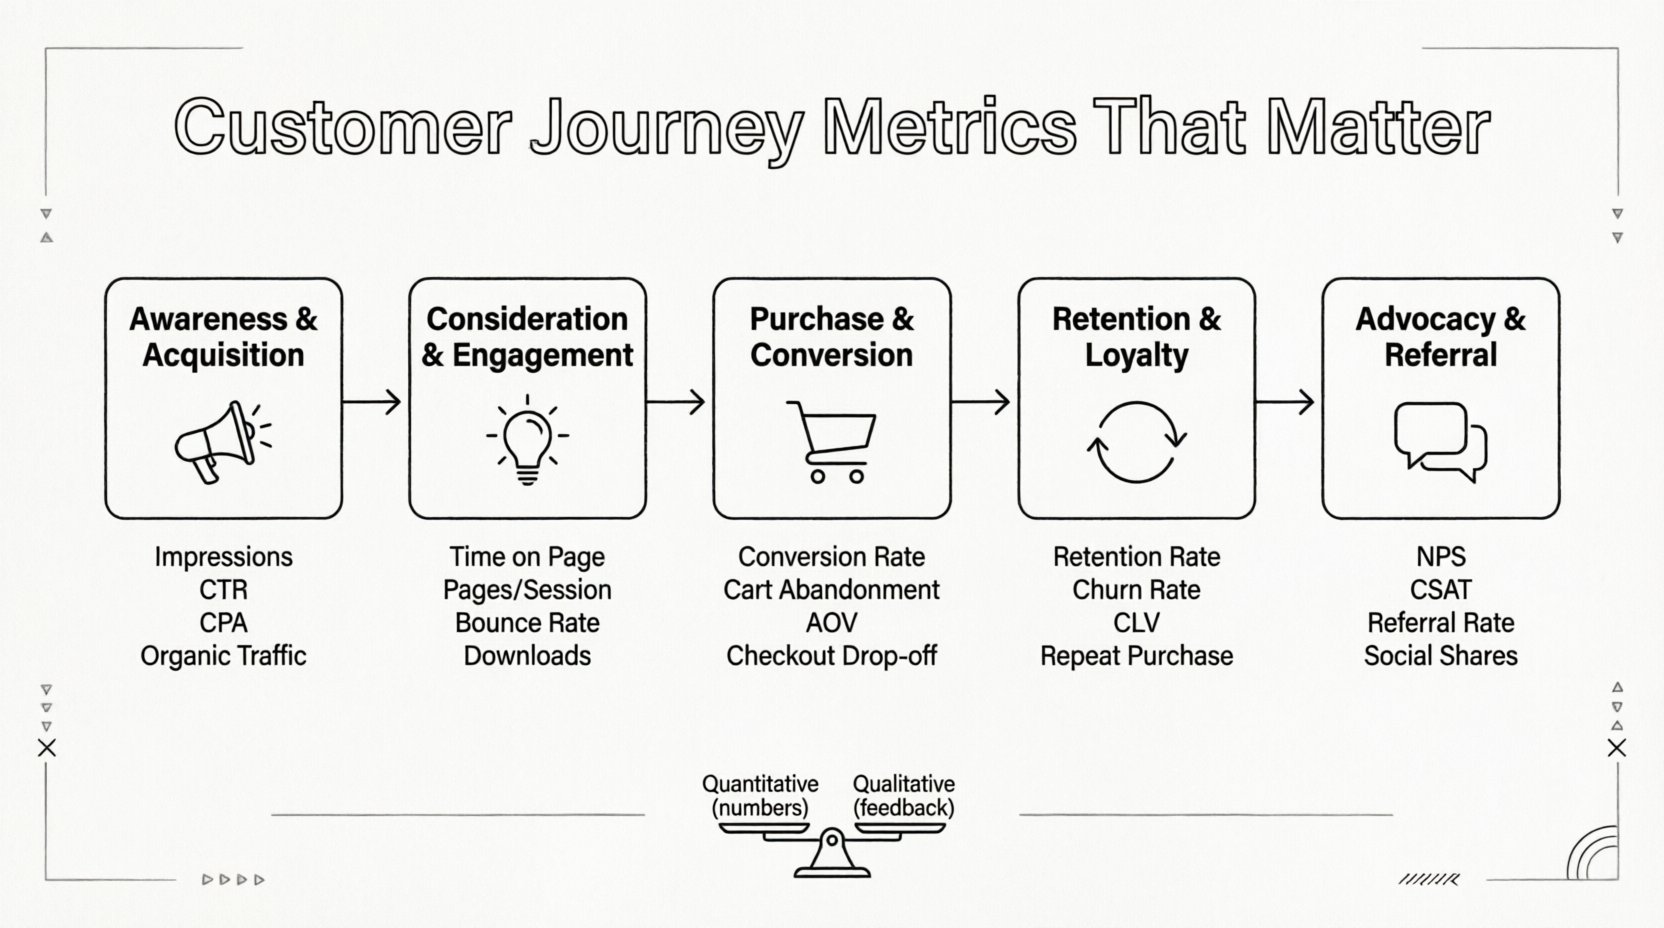
1. Awareness & Acquisition Metrics 📢
This is the entry point. The goal here is visibility. You want to know if potential customers are seeing your brand and if they are interested enough to stop scrolling.
- Impressions: The total number of times your content is displayed. High impressions indicate reach, but not necessarily interest.
- Click-Through Rate (CTR): The percentage of people who saw your content and clicked on it. This measures initial engagement quality.
- Cost Per Acquisition (CPA): The total cost to gain a new customer through a specific channel. This helps determine if marketing spend is efficient.
- Organic Traffic Volume: The number of visitors arriving via search engines without paid promotion. This signals brand authority and relevance.
When analyzing this stage, focus on the quality of traffic. High traffic numbers are meaningless if the visitors do not match your target persona. Look at bounce rates on landing pages to see if the messaging matches the ad or search query that brought them there.
2. Consideration & Engagement Metrics 💭
Once a customer arrives, they are evaluating options. They are comparing you to competitors. This stage is about trust and education. The goal is to keep them engaged long enough to consider a purchase.
- Time on Page: Indicates how much value the content provides. Short times may suggest confusion or lack of interest.
- Pages per Session: Shows how deeply a user explores your site. More pages usually mean higher intent.
- Bounce Rate: The percentage of visitors who leave after viewing only one page. High rates here suggest a disconnect between expectation and reality.
- Content Downloads: Actions like downloading a whitepaper or case study. This signals a desire for more information.
In this phase, engagement is a leading indicator of conversion. If users are interacting with support articles or watching demo videos, they are moving toward a decision. Track how long it takes them to move from the first visit to a significant engagement event.
3. Purchase & Conversion Metrics 💳
This is the critical moment of transaction. The goal is to make the path as smooth as possible. Any friction here results in lost revenue.
- Conversion Rate: The percentage of visitors who complete a desired action, such as buying a product or signing up.
- Cart Abandonment Rate: The percentage of users who add items to a cart but do not complete the purchase. This is often a sign of unexpected costs or complex checkout flows.
- Average Order Value (AOV): The average amount spent each time a customer places an order. Increasing this improves profitability without needing more traffic.
- Checkout Drop-off Rate: Identifies the specific step in the checkout process where users leave.
Optimization in this stage requires close attention to the user interface. If the checkout process requires too many clicks or asks for unnecessary information, conversion rates will suffer. A/B testing different forms and layouts can reveal which approach yields better results.
4. Retention & Loyalty Metrics 🔄
Acquiring a new customer is often more expensive than keeping an existing one. This stage focuses on satisfaction and repeat business. A loyal customer provides a steady stream of revenue.
- Customer Retention Rate: The percentage of customers who continue to do business over a specific period.
- Churn Rate: The percentage of customers who stop using the product or service. High churn indicates dissatisfaction.
- Customer Lifetime Value (CLV): The total revenue a business can expect from a single customer account. This guides how much you can spend on acquisition.
- Repeat Purchase Rate: The percentage of customers who have made more than one purchase.
Retention metrics reveal the health of the relationship. If CLV is high but churn is also high, it means you are acquiring big spenders but losing them quickly. Balancing these two is key to sustainable growth.
5. Advocacy & Referral Metrics 🗣️
The final stage is where satisfied customers become promoters. They recommend your brand to others. This organic growth is powerful and cost-effective.
- Net Promoter Score (NPS): Measures the likelihood of a customer recommending you to others. It is a strong indicator of overall loyalty.
- Customer Satisfaction Score (CSAT): Measures satisfaction with a specific interaction or transaction.
- Referral Rate: The percentage of new customers who come from existing customer referrals.
- Social Shares: How often your content is shared on social platforms. This indicates content resonance.
Advocacy is the ultimate validation of your product. If customers are actively promoting you, your value proposition is clear. Track these metrics to identify your brand ambassadors and incentivize their efforts.
Quantitative vs Qualitative Data Comparison 📊
Numbers tell you what is happening, but stories tell you why. Effective measurement requires blending quantitative data (numbers) with qualitative data (feedback).
| Type | Focus | Examples | Best Used For |
|---|---|---|---|
| Quantitative | Behavior & Volume | Clicks, Time, Conversion Rate | Identifying trends and patterns |
| Qualitative | Reasons & Feelings | Surveys, Interviews, Feedback | Understanding motivation and pain points |
| Behavioral | Actions Taken | Heatmaps, Session Recordings | Seeing how users physically navigate |
When quantitative data shows a drop-off, qualitative data explains the cause. For example, if cart abandonment spikes at the shipping cost page, a survey can confirm if the price is the issue or if the delivery speed is too slow.
Common Measurement Pitfalls ⚠️
Even with the right metrics in mind, organizations often make mistakes that skew the data. Avoiding these traps ensures your strategy remains sound.
- Vanity Metrics: Focusing on numbers that look good but don’t drive action. For example, total page views without context on user intent.
- Data Silos: Keeping data separate in different departments. Marketing data should align with sales and support data for a full view.
- Ignoring Context: Comparing data without accounting for seasonality. A drop in sales in December might be normal, not a problem.
- Over-Correction: Changing the strategy too frequently based on short-term fluctuations. Look for long-term trends.
- Missing the Mobile View: Ignoring how mobile users behave compared to desktop users. Mobile traffic often has different patterns and conversion rates.
To mitigate these issues, establish clear definitions for every metric. Ensure that “conversion” means the same thing to everyone in the organization. Regularly audit your data sources to ensure accuracy.
Establishing a Continuous Feedback Loop 🔁
Measurement is not a one-time task. It is an ongoing cycle of collecting, analyzing, acting, and re-evaluating. Once you have identified your metrics, you must integrate them into your regular operations.
Start by setting up dashboards that visualize the most critical data points. These should be accessible to key stakeholders. Regular review meetings ensure that the data informs decision-making.
- Weekly Reviews: Check for immediate issues, such as site outages or sudden drops in traffic.
- Monthly Deep Dives: Analyze trends over longer periods to spot emerging patterns.
- Quarterly Strategy Adjustments: Use the accumulated data to pivot strategy or reallocate budget.
Feedback loops also involve listening to the customer directly. If the data shows a problem, ask the customer about it. If the data shows success, ask them what they liked. This creates a culture of continuous improvement.
Connecting the Dots: Attribution Models 🧩
Understanding which touchpoint led to a sale is complex. A customer might see an ad, read a blog post, receive an email, and then search for the brand name before buying. Which one gets credit?
Attribution models help assign value to different interactions. Common approaches include:
- First-Touch: Gives credit to the very first interaction. Good for awareness campaigns.
- Last-Touch: Gives credit to the final interaction before conversion. Good for closing deals.
- Multitouch: Distributes credit across all interactions. Provides a more complete picture of the journey.
Choosing the right model depends on your sales cycle length and business goals. A long sales cycle often requires multitouch attribution to understand the influence of nurturing content.
Final Thoughts on Data-Driven Journeys
Tracking metrics that matter is about clarity. It strips away the noise and highlights what truly influences customer behavior. By focusing on the five core stages and balancing quantitative with qualitative data, you build a robust understanding of your audience.
The goal is not just to collect numbers, but to use them to improve the experience. Every metric should have a corresponding action plan. If a metric shows a problem, there must be a process to fix it. If it shows an opportunity, there must be a plan to capitalize on it.
Start small. Pick one stage of the journey and measure it deeply. Once you understand that, expand to the next. This methodical approach prevents overwhelm and ensures steady progress. Over time, the accumulation of accurate data will reveal the true shape of your customer journey, allowing you to optimize it for the long term.