


Software systems grow complex over time. What begins as a simple script expands into a network of interacting components. Without a clear map, developers often find themselves navigating a labyrinth of dependencies where the origin of a bug or the destination of data is unclear. This is where visual modeling becomes essential. Specifically, the class diagram serves as the architectural blueprint for object-oriented applications. It does more than list classes; it illustrates how data moves, transforms, and persists across the system.
Understanding the core structure of an application requires looking beyond the code itself. It requires a representation that abstracts away syntax and focuses on logic, relationships, and flow. By mastering the construction of class diagrams, teams can anticipate bottlenecks, clarify responsibilities, and ensure that data integrity is maintained from the user interface down to the database layer. This guide explores the mechanics of mapping application structure through visual design.
🧱 The Foundation of Class Diagrams
A class diagram is a static structure diagram in the Unified Modeling Language (UML). It describes the structure of a system by showing the system’s classes, their attributes, operations (or methods), and the relationships among objects. Unlike a sequence diagram, which captures dynamic behavior over time, a class diagram provides a snapshot of the system’s design at a specific moment.
Why is this snapshot valuable? It acts as a contract between design and implementation. When a developer writes code, they are essentially fulfilling the promises made in the diagram. If the diagram shows a specific relationship between two classes, the code must reflect that connection. This alignment reduces technical debt and prevents the system from becoming a collection of loosely connected files.
🏗️ Anatomy of a Class
To visualize data flow effectively, one must first understand the components that make up a class. A standard class diagram box is typically divided into three sections:
- Class Name: Located at the top, this is usually a noun representing an entity within the system. It should be capitalized (e.g.,
CustomerorOrderProcessor). - Attributes: The middle section lists the data held by the class. These are the properties or state variables. Examples include
email_address,balance, orstatus. - Operations: The bottom section details the methods or functions the class can perform. These are the verbs. Examples include
calculate_total(),send_notification(), orupdate_profile().
Each attribute and operation is assigned a visibility modifier that dictates how it interacts with other parts of the system. Understanding these modifiers is crucial for tracking data flow.
| Modifier | Symbol | Access Level | Implication for Data Flow |
|---|---|---|---|
| Public | + |
Accessible by all | Data can be read or modified by any other class. Creates open pathways. |
| Private | - |
Accessible only within the class | Data is encapsulated. Flow must occur through public methods. |
| Protected | # |
Accessible by subclasses | Data flows within the inheritance hierarchy but remains hidden from external classes. |
| Package | ~ |
Accessible within the package | Data flows freely among related modules but is restricted elsewhere. |
🔗 Defining Relationships and Associations
Classes rarely exist in isolation. They exist in a web of interactions. The lines connecting the class boxes represent relationships. These relationships define how data is passed and how dependencies are formed. Misunderstanding a relationship can lead to tight coupling, where changing one class breaks another.
There are four primary types of relationships to visualize:
- Association: A simple link between two classes indicating they know about each other. It represents a bidirectional or unidirectional flow of references. For example, a
ManagermanagesEmployees. - Aggregation: A specific type of association representing a “whole-part” relationship where the part can exist independently of the whole. If the
Teamis dissolved, thePlayerobjects still exist. - Composition: A stronger form of aggregation where the part cannot exist without the whole. If the
Houseis deleted, theRoomobjects cease to exist. This implies a strict lifecycle dependency. - Inheritance (Generalization): Represents an “is-a” relationship. A
Vehicleis a parent toCarandTruck. Data flows from the child to the parent, inheriting attributes and methods.
📈 Visualizing Data Flow Dynamics
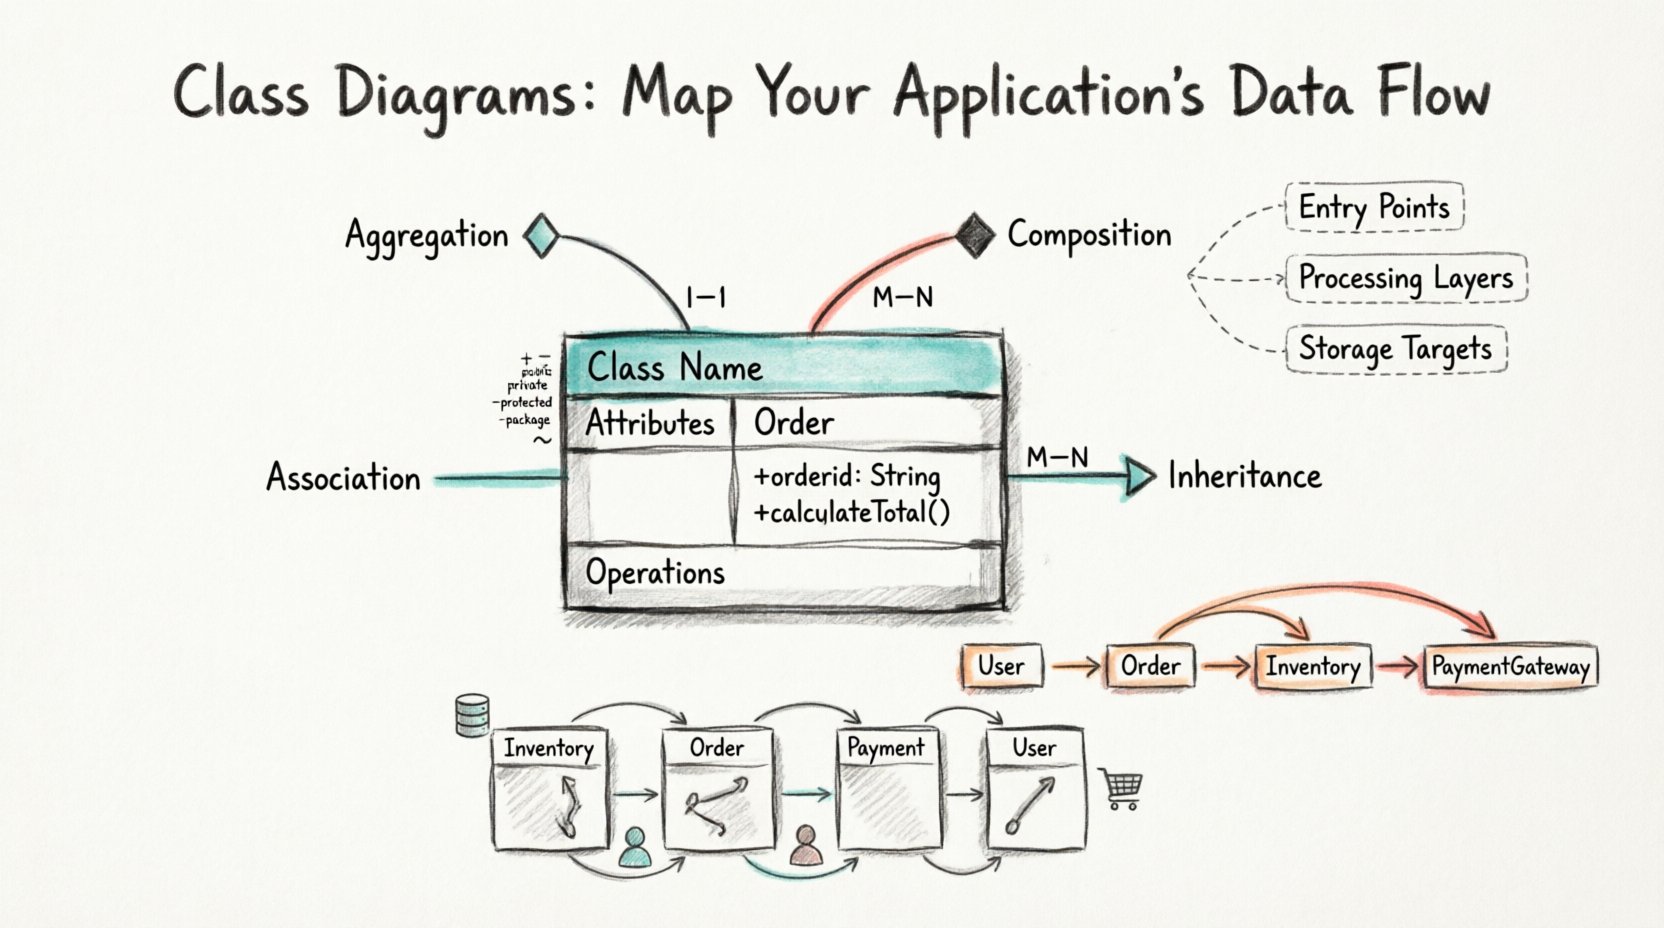
While a class diagram is static, it implies dynamic behavior. By tracing the lines between classes, you can map the potential pathways of data. Consider a transaction system. Data might flow from a User class to an Order class, then to an Inventory class, and finally to a PaymentGateway class.
Visualizing this flow helps identify:
- Entry Points: Where does data enter the system? Which class handles the initial request?
- Processing Layers: Which classes transform the data? Are there separate classes for validation versus calculation?
- Storage Targets: Where is the data persisted? Which classes represent the database entities?
- Return Paths: How does the result travel back to the user? Does the
Orderclass return a confirmation object to theUserclass?
When mapping these flows, pay attention to cardinality. Cardinality defines the quantity of instances involved in a relationship. Is it one-to-one? One-to-many? Many-to-many? This dictates how data is retrieved and aggregated.
| Cardinality | Notation | Example | Data Flow Impact |
|---|---|---|---|
| One-to-One | 1 — 1 | Person — Passport | Direct lookup. High efficiency. |
| One-to-Many | 1 — N | Customer — Order | Iteration required. List or array handling. |
| Many-to-Many | M — N | Student — Course | Requires a junction table or linking class. |
🛡️ Best Practices for Maintainability
A diagram is only useful if it remains accurate. As the application evolves, the diagram must evolve with it. Here are strategies to keep the visualization effective:
- Keep it High-Level First: Start with domain classes (e.g.,
Product,Cart) before diving into infrastructure classes (e.g.,DatabaseConnection). This prevents the diagram from becoming cluttered with implementation details. - Use Interfaces: When multiple classes implement the same behavior, use an interface. This clarifies that the data flow depends on the contract of the interface, not the specific implementation. It reduces dependency.
- Group Related Classes: Use packages or namespaces to group classes that belong to the same module. This creates logical boundaries and limits the scope of data flow queries.
- Document Constraints: Add notes to the diagram for business rules that cannot be visually represented. For example, a note might state that an
Ordercannot be cancelled after 24 hours. - Limit Depth: Avoid nesting relationships too deeply. If a class interacts with five other classes directly, consider if it is too complex. High coupling often indicates a need for refactoring.
⚠️ Common Pitfalls in Modeling
Even experienced architects make mistakes when drawing these structures. Being aware of common errors helps in producing a cleaner map of the application.
- Mixing Responsibilities: A class should do one thing well. If a
Userclass handles authentication, profile updates, and email sending, the data flow is tangled. Split these intoAuthService,ProfileService, andEmailService. - Ignoring Nullability: Every attribute should have a defined state. Is a
phoneNumberrequired? If it is optional, the data flow must account for null checks. Visualizing this prevents runtime errors. - Over-Modeling: Not every variable needs to be drawn. If a variable is a temporary local calculation, it does not belong in the structural diagram. Focus on persistent state and core interactions.
- Static Methods Abuse: Static methods imply a lack of state. While sometimes necessary, overusing them breaks the object-oriented flow. They should be minimized in favor of instance methods to maintain clear data ownership.
🔄 Integration with Development Lifecycle
Class diagrams are not just for the design phase. They play a role throughout the software development lifecycle.
During Planning
Before writing a single line of code, the diagram helps stakeholders visualize the scope. It allows for early detection of missing entities. For instance, realizing that a Review class is needed before the Product class is finalized.
During Coding
Developers use the diagram as a reference to ensure they are implementing the correct attributes. It serves as a source of truth for code generation tools, which can scaffold the class structures automatically based on the model.
During Testing
Testers use the diagram to understand the dependencies between modules. If a bug appears in the Reporting module, the diagram shows which upstream classes provide the data, narrowing the search area.
During Maintenance
When onboarding new developers, the diagram provides a high-level overview of the system. It explains how data travels through the application faster than reading through thousands of lines of code.
🧩 Real-World Scenarios
Let us consider a specific scenario: an E-commerce Platform. The core structure involves several key domains.
- Inventory Domain: Contains
Product,Warehouse, andStockLevel. Data flows here for adding, removing, or updating items. - Order Domain: Contains
Order,OrderItem, andShippingAddress. Data flows here when a purchase is initiated. - Payment Domain: Contains
PaymentTransactionandInvoice. Data flows here to confirm financial settlement. - User Domain: Contains
CustomerandWallet. Data flows here to manage identity and funds.
In this structure, the Order class is central. It holds a reference to the Customer, contains a list of OrderItems, and references a PaymentTransaction. The data flow is sequential: Customer selects items -> Order is created -> Payment is processed -> Inventory is updated. A class diagram makes this sequence visible as a chain of associations.
Without this visualization, a developer might accidentally allow an order to be placed without checking inventory, or allow payments to be processed before the order is confirmed. The diagram enforces the logic through its structure.
🛠️ Implementation and Documentation
Creating these diagrams involves a balance between precision and readability. When documenting the structure, ensure that the naming conventions are consistent. Use camelCase for attributes and PascalCase for classes. This consistency reduces cognitive load when reading the diagram.
Furthermore, version control is vital. The diagram file should be stored alongside the codebase. If the code changes and the diagram does not, the diagram becomes obsolete documentation, which is worse than no documentation at all. Automated tools can sometimes sync code changes to diagrams, but manual review remains necessary to ensure the logic still holds.
🔍 Analyzing Data Flow Through Attributes
Attributes are the storage vessels for data. In a class diagram, the type of attribute dictates the flow. For example, a String attribute holds text, while a Date attribute holds time-sensitive data. A Boolean attribute holds a state.
When mapping data flow, consider the lifecycle of an attribute:
- Creation: How is the attribute initialized? Is it set in the constructor?
- Modification: Which methods change this attribute? Is it read-only?
- Deletion: When is this attribute removed? Does it trigger a cascade delete in related classes?
By annotating these lifecycles on the diagram, you create a narrative of data movement. For instance, marking a status attribute as read-only after a certain state is reached prevents accidental updates that could corrupt the workflow.
🚀 Conclusion
Visualizing data flow through class diagrams is a discipline that pays dividends in system stability and developer efficiency. It transforms abstract logic into a tangible structure that can be reviewed, critiqued, and improved. By focusing on the core structure and relationships, teams can build applications that are robust, scalable, and easier to understand.
The effort invested in drawing these diagrams is an investment in the future of the codebase. It clarifies intent, reduces ambiguity, and ensures that the data flowing through the application serves its purpose without unexpected detours. As systems grow, the need for clear maps becomes not just helpful, but necessary for survival.