


Creating a customer journey map is more than just drawing a line from point A to point B. It is a strategic exercise that reveals how your customers interact with your brand at every single stage. When executed correctly, this process uncovers hidden friction, highlights opportunities for engagement, and aligns internal teams around a shared customer vision. For businesses aiming for sustainable expansion, understanding the customer path is not optional; it is foundational.
This guide details the methodology for planning a robust journey map designed to drive immediate growth. We will move beyond theory into practical application, focusing on actionable insights, data integration, and cross-functional collaboration. By the end of this process, you will have a living document that informs decision-making across marketing, sales, and support.
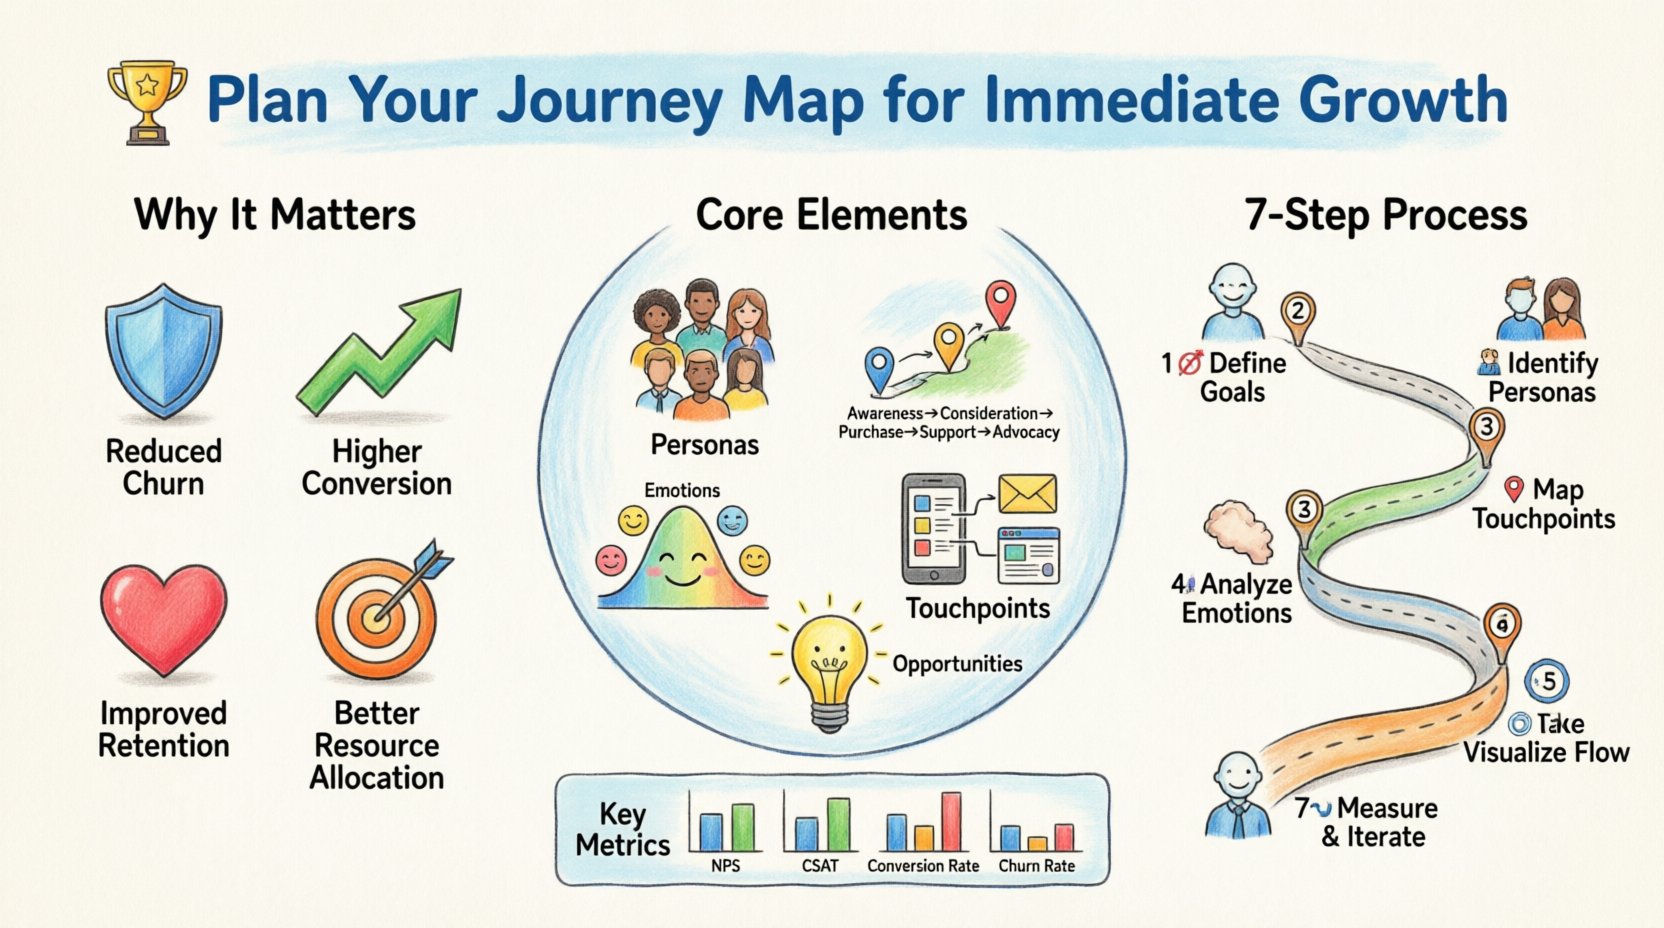
Why Customer Journey Mapping Drives Real Business Value 🏆
Many organizations operate in silos, where marketing messages do not match sales follow-ups, or support experiences contradict product usage. A journey map bridges these gaps. It visualizes the end-to-end experience, ensuring consistency and clarity.
Investing time in this planning phase yields tangible returns:
- Reduced Churn: Identifying pain points before they cause customers to leave.
- Higher Conversion: Smoothing out obstacles in the purchase funnel.
- Improved Retention: Enhancing post-purchase support and engagement.
- Better Resource Allocation: Focusing budget on touchpoints that actually matter to the customer.
Without a map, teams are guessing. With a map, decisions are based on observed behavior and reported sentiment.
Core Elements of an Effective Map 🧩
Before drawing lines and boxes, you must understand the building blocks of a journey map. A comprehensive map includes specific dimensions that provide context to the customer’s actions.
| Element | Definition | Example |
|---|---|---|
| Personas | Representative user archetypes | “Tech-Savvy Early Adopter” vs. “Budget-Conscious Family” |
| Stages | Phases of the relationship | Awareness, Consideration, Purchase, Support, Advocacy |
| Touchpoints | Specific interactions | Website landing page, Email newsletter, Phone call |
| Emotions | How the customer feels | Excited, Confused, Frustrated, Satisfied |
| Opportunities | Areas for improvement | Add FAQ section, Reduce checkout steps |
Step 1: Define Your Objectives and Scope 🎯
Every successful mapping project begins with a clear goal. You cannot map every single interaction for every single customer type in one go. You must define the boundaries of this exercise.
Setting Clear Goals
Ask yourself what you hope to achieve. Is it reducing support ticket volume? Is it increasing upsell revenue? Is it improving onboarding time? Your answer dictates the scope.
- Growth Focus: If the goal is growth, focus on the conversion funnel and retention loops.
- Experience Focus: If the goal is satisfaction, focus on support interactions and complaint resolution.
- Operational Focus: If the goal is efficiency, focus on internal handoffs between departments.
Defining the Scope
Determine which customer segment you are analyzing. A journey for a new enterprise client differs vastly from a journey for a self-serve consumer user. Choose one primary segment to start. This keeps the data manageable and the insights specific.
Step 2: Identify Key Personas 🧑💼
A map without a persona is just a process flowchart. A persona gives the map a human face. It represents the specific needs, motivations, and behaviors of a group of users.
Creating the Persona Profile
Ensure your persona data is current. Outdated personas lead to outdated maps. Gather information from:
- CRM data and historical sales records.
- Customer interviews and feedback surveys.
- Support ticket analysis.
- Web analytics and session recordings.
Include demographic details, but prioritize psychographics. What are their goals? What are their fears? What drives them to choose your solution over a competitor?
Aligning on the Persona
Ensure all stakeholders agree on who the persona is. Marketing might define one way, while Product defines another. Hold a workshop to align on the persona’s definition. This prevents the common issue where the map satisfies one department but confuses another.
Step 3: Map the Touchpoints 📍
This is the core of the journey. List every point where the customer interacts with your brand. Do not limit this to digital channels. Physical interactions, phone calls, and even word-of-mouth referrals count.
Categorizing Channels
Group your touchpoints to see where the experience lives:
- Digital: Website, mobile app, social media, email, ads.
- Human: Sales calls, customer support chats, in-store visits.
- Automated: Notification emails, billing reminders, account status updates.
Identifying Handoffs
Pay close attention to where the customer moves from one channel to another. These are often high-risk areas for friction. For example, does the customer have to re-enter information when moving from a chat bot to a human agent? Does the sales team have access to the support history before making the first call?
Document the specific actions taken at each touchpoint. This creates a detailed log of the actual experience, not just the intended one.
Step 4: Analyze Emotions and Friction 🧠
Actions tell you what happened; emotions tell you why it mattered. Mapping the emotional state of the customer at each stage reveals the psychological journey.
The Emotion Curve
Draw a line across the bottom of your map representing customer sentiment. Mark peaks and valleys.
- Peaks: Moments of delight or high satisfaction. These should be protected and amplified.
- Valleys: Moments of frustration or confusion. These require immediate attention.
Pinpointing Friction
Friction is anything that slows down progress or adds unnecessary effort. Look for:
- Long wait times.
- Confusing navigation or language.
- Repetitive data entry.
- Lack of clear instructions.
- Inconsistent information across channels.
For every friction point identified, ask “What is the root cause?” Is it a technical bug? A policy restriction? A communication gap?
Step 5: Visualize the Flow 📊
A journey map must be readable. If stakeholders cannot understand it within five minutes, it will not be used. Use visual hierarchy to guide the eye.
Layout Best Practices
- Left to Right: Follow the chronological order of the journey.
- Top to Bottom: Group stages vertically for easy scanning.
- Color Coding: Use colors to denote sentiment (Green for happy, Red for frustrated, Yellow for neutral).
- Icons: Use simple icons to represent channels (e.g., envelope for email, phone for call).
Tools for Visualization
You do not need expensive software to create a map. Whiteboards, sticky notes, and collaborative digital workspaces work well. The goal is collaboration, not aesthetics. Ensure the visualization is accessible to non-designers.
Step 6: Translate Insights into Action 🛠️
A map that sits on a shelf is useless. The value comes from turning insights into initiatives. Create an action plan based on the friction points and opportunities identified.
Prioritizing Initiatives
Use a matrix to prioritize actions based on impact and effort.
| High Impact / Low Effort | High Impact / High Effort | Low Impact / Low Effort | Low Impact / High Effort |
|---|---|---|---|
| Quick Wins | Strategic Projects | Fill-ins | Do Not Do |
Assigning Ownership
Every action item needs an owner. Marketing owns the awareness stage. Sales owns the purchase stage. Support owns the retention stage. Ensure accountability is clear. Without ownership, improvements stall.
Step 7: Measure and Iterate 🔄
The customer journey is dynamic. It changes as the market changes, as new products launch, and as customer expectations evolve. A journey map is a living document, not a static report.
Key Metrics to Track
Define how you will measure the success of your improvements. Common metrics include:
- Net Promoter Score (NPS): Likelihood to recommend.
- Customer Satisfaction (CSAT): Satisfaction with specific interactions.
- Customer Effort Score (CES): Ease of completing tasks.
- Conversion Rate: Percentage of users moving between stages.
- Churn Rate: Percentage of users leaving the service.
Review Cadence
Schedule regular reviews. A quarterly review is often sufficient for stable products. For fast-moving startups, monthly reviews may be necessary. Update the map whenever significant changes occur in the product or service offering.
Common Mistakes to Avoid 🚫
Even with a solid plan, pitfalls exist. Avoid these common errors to ensure the process remains effective.
- Relying on Assumptions: Never guess what the customer thinks. Validate with data and direct feedback.
- Internal Bias: Do not map the process as the company *thinks* it works. Map it as the customer *experiences* it.
- Too Broad: Trying to map every single journey at once leads to confusion. Start with one critical path.
- Ignoring Internal Processes: The customer experience is often determined by internal workflows. If your internal teams are disorganized, the customer experience will suffer.
- One-Time Effort: Failing to update the map leads to outdated strategies. Treat it as an ongoing discipline.
Metrics That Matter 📏
To prove the value of your journey mapping, you must track the right numbers. Focus on metrics that reflect the specific stages of the map.
- Awareness Stage: Traffic sources, click-through rates, cost per acquisition.
- Consideration Stage: Time on site, content downloads, demo requests.
- Purchase Stage: Cart abandonment rate, checkout completion time.
- Retention Stage: Login frequency, feature adoption, renewal rates.
- Advocacy Stage: Referral rate, social mentions, review volume.
Correlate these metrics with the emotional peaks and valleys you identified. For instance, if the “Purchase Stage” has a high drop-off rate, check the sentiment data for that stage. Is there frustration? If so, what specific step is causing it?
Building a Culture of Customer-Centricity 🤝
The ultimate goal of journey mapping is to shift the organizational mindset. It moves the focus from “what can we sell” to “what does the customer need?”. This cultural shift is the most significant long-term benefit.
Sharing the Map
Distribute the map widely. Share it in onboarding sessions, team meetings, and strategy reviews. When every employee sees the customer journey, they understand how their role impacts the whole.
Feedback Loops
Create mechanisms for customer feedback to feed directly into the map. When a customer reports a bug or a complaint, it should trigger a review of the journey map. This ensures the map reflects reality.
Final Thoughts on Planning Your Map
Planning your journey map is an investment in your business’s future. It requires time, data, and cross-functional cooperation. However, the clarity it provides is unmatched. By understanding the path your customers take, you can remove obstacles and create moments of delight.
Start small, validate often, and keep the customer at the center of every decision. Growth follows a clear understanding of the path your users walk.