


Mapping the customer journey is an exercise in empathy and strategy. It involves visualizing the steps a user takes from discovery to retention. However, a map is only useful if the terrain matches reality. Without validation, journey maps remain theoretical constructs based on assumptions rather than observed behavior. This is where analytics becomes the critical tool for verification. By grounding your hypotheses in hard data, you move from guessing to knowing.
This guide explores how to rigorously test your assumptions about customer paths using quantitative evidence. We will look at the methodology for validation, the specific metrics required, and the common traps that lead to incorrect conclusions. The goal is to build a customer experience that is resilient, data-backed, and effective.
Why Hypothesis Validation Matters 🧪
In the absence of data, teams often rely on intuition. One stakeholder might believe that a checkout process is too complex, while another argues it is perfectly streamlined. Without validation, these debates continue indefinitely. Hypothesis validation shifts the conversation from opinion to evidence.
When you validate journey hypotheses, you achieve several key outcomes:
Resource Allocation: You invest time and money into changes that actually move the needle, not those that look good on paper.
Risk Reduction: You avoid rolling out features that disrupt established user flows.
Customer Insight: You uncover behaviors that users themselves may not articulate in surveys or interviews.
Iterative Improvement: You create a feedback loop where every change is measured against a baseline.
A journey hypothesis is essentially a statement predicting user behavior. For example, “Users who view the pricing page will drop off at the contact form step.” This statement requires testing. If the data contradicts it, the hypothesis is false, and the strategy must change.
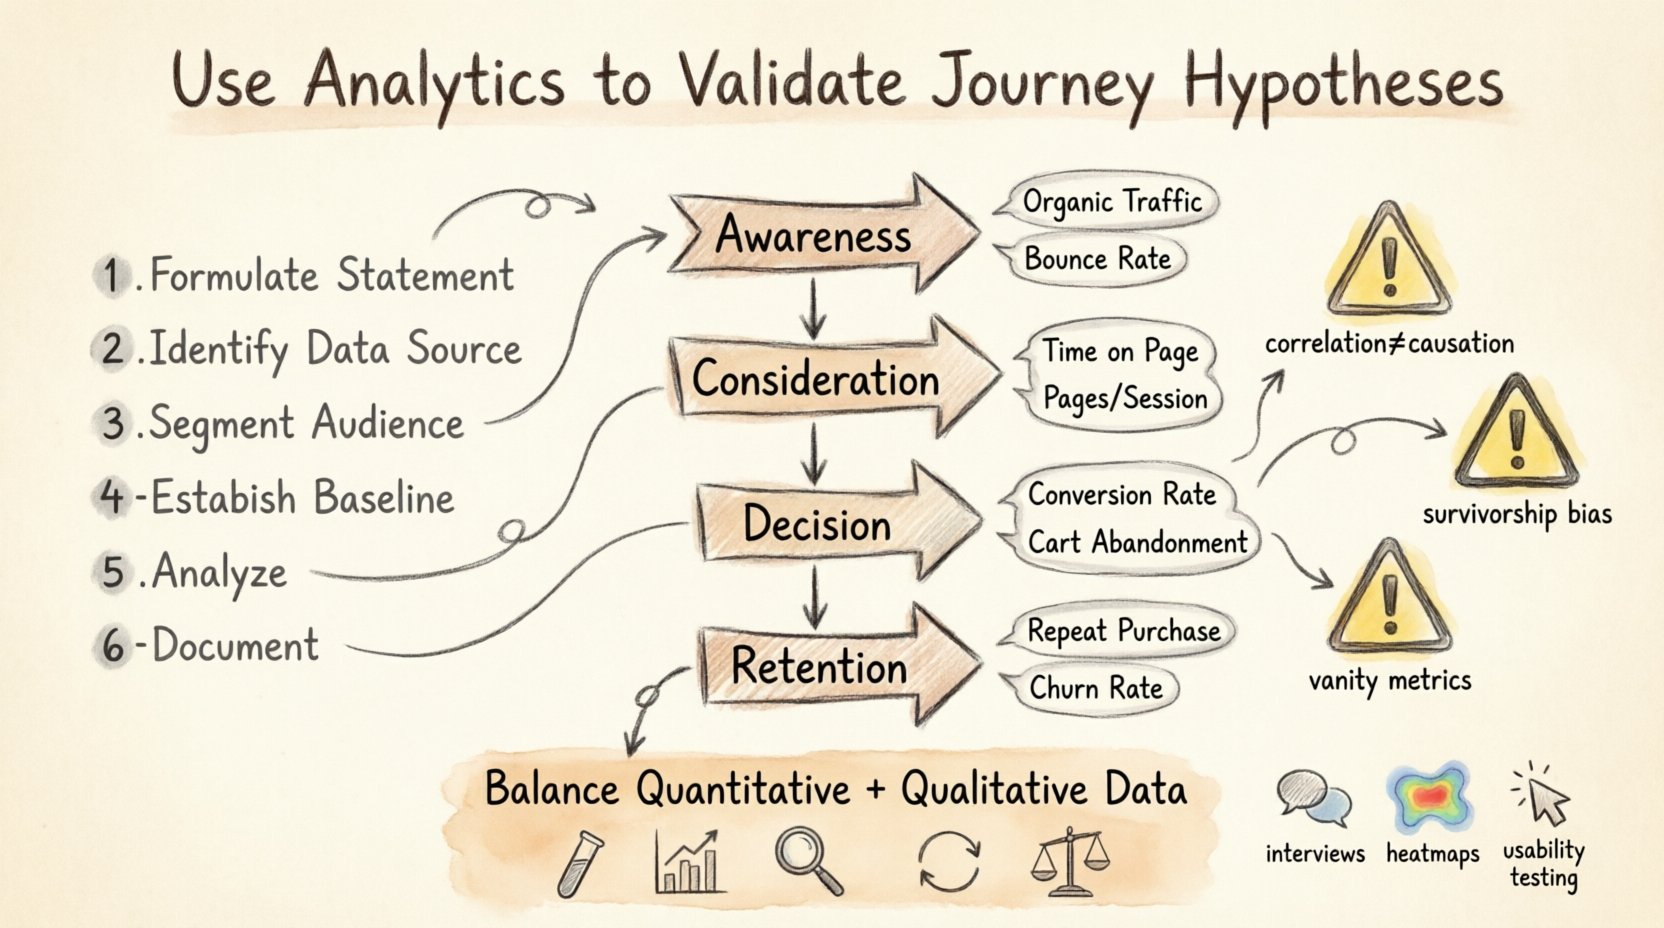
Defining the Metrics That Matter 📊
To validate a hypothesis, you need specific data points. General traffic numbers are insufficient. You need metrics that align with the specific stage of the journey you are examining. Different stages of the funnel require different indicators of success.
Here is a breakdown of common journey stages and the corresponding metrics that provide validation:
Journey Stage | Primary Metric | Secondary Metric | What It Validates |
|---|---|---|---|
Awareness | Organic Traffic | Bounce Rate | Are we reaching the right audience? |
Consideration | Time on Page | Pages per Session | Is the content engaging enough? |
Decision | Conversion Rate | Cart Abandonment | Is the offer compelling and friction low? |
Retention | Repeat Purchase Rate | Churn Rate | Does the product deliver on promises? |
Understanding these distinctions is vital. For instance, a high bounce rate on a blog post might not be negative if the user found the answer they needed and left. However, a high bounce rate on a pricing page suggests confusion or lack of interest. Context dictates the metric.
The Validation Process Step-by-Step 🔍
Validating a hypothesis is not a one-time event. It is a systematic process that requires preparation, execution, and analysis. Follow this workflow to ensure your findings are accurate.
1. Formulate a Clear Statement
Before looking at data, write down exactly what you expect to happen. Vague statements yield vague results. Instead of saying “Sales are low,” say “Users who land on the mobile version of the pricing page have a 20% lower conversion rate than desktop users.” This specificity allows for binary validation.
2. Identify the Data Source
Determine where the data lives. Is it in your web analytics platform, your CRM, or your session recording tools? Ensure that the data collection method is set up correctly. If you are tracking a specific button click, verify that the event tag fires every time the button is clicked. Inaccurate tagging leads to invalid hypotheses.
3. Segment the Audience
Aggregated data often hides the truth. A 5% conversion rate might look average, but if it is 2% for mobile users and 8% for desktop users, the aggregate number masks a critical issue. Segment your data by device, location, referral source, and user type (new vs. returning).
4. Establish a Baseline
You cannot measure change without a starting point. Calculate the current performance of the metric over a significant period, typically 30 to 90 days. This baseline protects you against seasonal anomalies. If you test a change during a holiday, your results will not reflect normal behavior.
5. Analyze and Interpret
Once you have the data, look for patterns. Are there specific drop-off points? Do certain segments behave differently? Use visualizations to spot trends quickly. Remember to look for statistical significance. A small fluctuation in a small sample size is likely noise, not a signal.
6. Document the Outcome
Record whether the hypothesis was confirmed or rejected. If rejected, document why. This knowledge becomes part of your institutional memory. It prevents the team from revisiting the same assumption in the future.
Common Pitfalls in Data Interpretation ⚠️
Even with robust data, interpretation errors can derail a validation effort. Being aware of these common traps helps maintain the integrity of your analysis.
Correlation vs. Causation: Just because two metrics move together does not mean one caused the other. If website traffic drops while support tickets rise, it does not mean traffic caused the tickets. It might be a third factor, like a server outage.
Survivorship Bias: Focusing only on the users who completed the journey ignores those who left early. You must analyze the drop-off points, not just the finishers.
Vanity Metrics: Page views and session counts often look impressive but do not indicate business value. Focus on conversion metrics and retention rates instead.
Sample Size Errors: Making decisions based on data from a single day or a very small user group is dangerous. Ensure your sample size is large enough to be statistically significant.
Ignoring Qualitative Context: Numbers tell you what happened, but not why. If conversion drops, analytics show the drop, but user feedback or session recordings explain the reason.
Iterating Based on Evidence 🔄
Validation is not the end of the road; it is the foundation for iteration. If a hypothesis is validated, you know the current path works. If it is rejected, you know you need to pivot. This cycle creates a culture of continuous improvement.
When a hypothesis fails, do not view it as a failure of the team. View it as a discovery. You have learned that a specific assumption was incorrect. This saves resources in the long run by preventing investment in ineffective strategies.
Consider the following workflow for iteration:
Review Findings: Gather the team to discuss the data results.
Formulate New Hypothesis: Based on the new data, create a new prediction. For example, “If we simplify the form fields, conversion will increase by 10%.”
Implement Change: Deploy the modification to a controlled segment of users.
Measure Again: Run the validation process again to see if the new change produced the expected result.
This loop ensures that every decision is informed by reality. Over time, your journey maps become more accurate representations of the actual customer experience.
Balancing Quantitative and Qualitative Data ⚖️
Analytics provides the “what,” but qualitative data provides the “why.” Relying solely on numbers can lead to cold, mechanical decisions. A high exit rate on a page might be due to a technical error, or it might be because the content is misleading. Analytics can show the exit rate, but it cannot explain the frustration.
To get a complete picture, combine quantitative validation with qualitative research:
User Interviews: Ask users why they abandoned a flow.
Usability Testing: Watch users attempt to complete tasks in real-time.
Heatmaps: Visual representations of where users click and scroll.
Feedback Widgets: Direct input from users on specific pages.
When quantitative data flags an issue, qualitative data helps diagnose it. For example, if analytics show a high drop-off at the payment step, usability testing might reveal that the credit card field is not responsive on older Android devices. This combination creates a robust validation strategy.
Technical Considerations for Data Integrity 🔧
The accuracy of your validation depends entirely on the quality of your data. If the tracking is flawed, the hypothesis validation is meaningless. Here are technical standards to maintain:
Consistent Naming Conventions: Ensure events are named consistently across the platform. “Click_Submit” and “Submit_Click” should be treated as the same event.
Data Privacy: Ensure compliance with regulations like GDPR or CCPA. Do not track personally identifiable information (PII) unless consent is explicit.
Server-Side Tracking: Consider moving tracking to the server side to reduce the impact of ad blockers and browser restrictions on data accuracy.
Cross-Device Tracking: Users often switch between devices. Use persistent identifiers where possible to track the full journey across mobile and desktop.
Regular Audits: Schedule quarterly audits of your tracking setup to ensure tags are firing correctly and data is flowing as expected.
Building a Culture of Validation 🏗️
Technical setup is only half the battle. You need an organizational culture that values evidence over hierarchy. In many teams, the senior executive’s opinion carries the most weight. This can stifle data-driven decision-making.
To build a culture of validation:
Make Data Accessible: Ensure that team members can view relevant dashboards without needing to ask data analysts for every report.
Encourage Skepticism: Reward team members who challenge assumptions with data. Create a safe space for disagreement based on evidence.
Share Learnings: Create a repository of validated hypotheses and results. This builds a knowledge base for the entire organization.
Set Expectations: Make it clear that every major change requires a hypothesis and a measurement plan before implementation.
When the entire team understands the value of validation, the journey mapping process becomes a living document. It evolves as the business evolves and as customer behaviors shift.
Long-Term Value of Validated Journeys 📈
The effort required to validate journey hypotheses pays dividends over time. A validated journey map is an asset that improves conversion rates, reduces support costs, and increases customer lifetime value.
Companies that rely on validated data tend to have more predictable growth. They do not rely on viral spikes or luck. They build systems that work consistently. By continuously testing and refining the customer journey, you create a competitive advantage that is difficult for others to replicate.
Furthermore, validated data builds trust with stakeholders. When you can show a clear line from a specific change to a specific business outcome, securing budget for future initiatives becomes easier. You move from asking for permission to demonstrating value.
Final Thoughts on Journey Intelligence 💡
Customer journey mapping is not a static activity. It is a dynamic process that requires constant attention to data. By treating every journey map as a hypothesis waiting to be tested, you ensure that your strategies remain grounded in reality. Analytics provides the compass, but you must steer the ship.
Start small. Pick one key journey stage and formulate a hypothesis. Gather the data. Analyze the results. Learn. Then move to the next. Over time, this disciplined approach will transform how your organization understands and serves its customers. The result is a customer experience that is not just imagined, but proven.