Executive Summary
In today’s fast-paced software development landscape, maintaining accurate and up-to-date documentation remains one of the most significant challenges facing engineering teams. This case study explores how integrating Visual Paradigm (VP) with OpenDocs through VPasCode creates a seamless, bidirectional workflow that transforms static diagrams into living documentation assets. By examining the implementation of this integrated approach at TechFlow Solutions, we demonstrate measurable improvements in documentation accuracy, team productivity, and knowledge retention.
Introduction
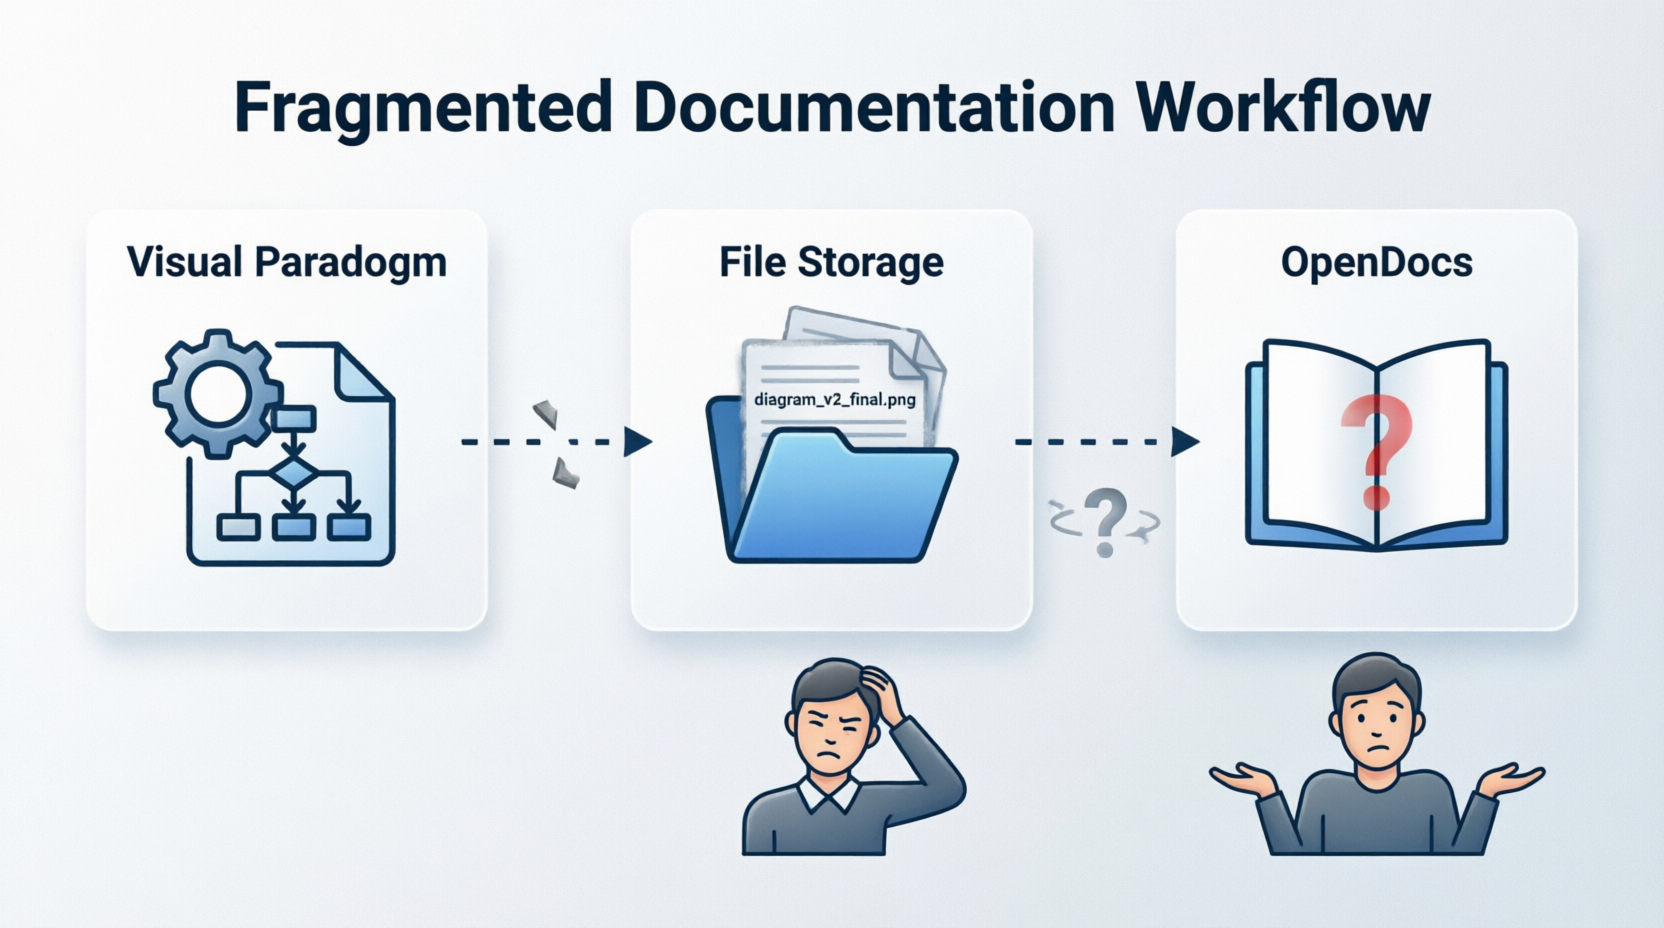
The disconnect between visual system architecture and textual documentation has long plagued software development teams. Traditional workflows require manual synchronization between diagramming tools and documentation platforms, leading to outdated visuals, inconsistent information, and wasted developer hours. As systems grow more complex and agile methodologies demand rapid iteration, these friction points become critical bottlenecks.
This case study examines how organizations can leverage the integration between Visual Paradigm’s powerful modeling capabilities and OpenDocs’ centralized documentation platform to create a unified knowledge management ecosystem. Through the intermediary VPasCode engine, teams achieve automatic synchronization between visual models and their supporting documentation, ensuring that architectural insights remain current, accessible, and contextually rich throughout the entire software development lifecycle.
Figure 1: The Traditional Documentation Workflow Challenge
Background: The Documentation Dilemma
The Problem Space
TechFlow Solutions, a mid-sized fintech company with 150+ engineers, faced a common yet critical challenge: their system architecture documentation was perpetually outdated. Despite having excellent diagramming practices using Visual Paradigm and comprehensive documentation in their OpenDocs repository, the two existed in parallel universes.
Key pain points included:
-
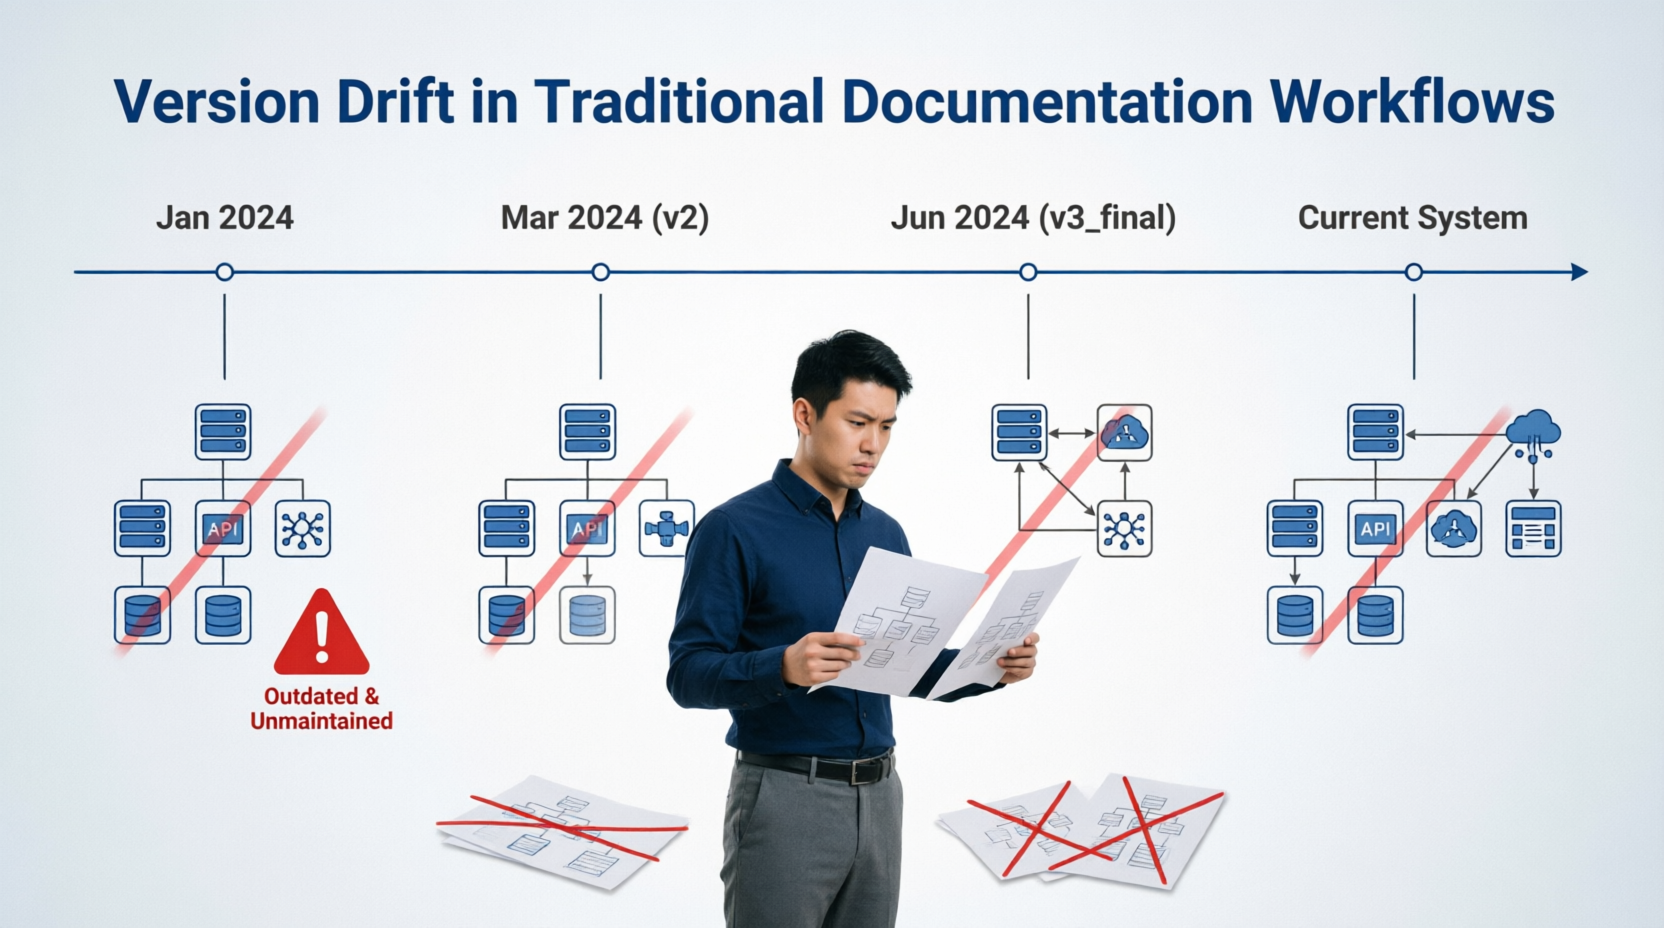
Version drift: Diagrams exported as PNG files became stale within weeks of creation
-
Context loss: Stakeholders viewing diagrams in isolation lacked understanding of design decisions
-
Manual overhead: Developers spent an average of 4-6 hours per week managing documentation assets rather than creating them
-
Knowledge silos: Critical architectural rationale existed only in individual developers’ minds or scattered across multiple platforms
Figure 2: Version Drift in Traditional Workflows
The Opportunity
Recognizing that their existing tool stack (Visual Paradigm and OpenDocs) already contained the necessary components, TechFlow’s engineering leadership sought to bridge the gap through automation and integration rather than adopting entirely new platforms.
Solution Architecture: The Integrated Workflow
Overview of the VP-to-OpenDocs Pipeline
The implemented solution creates a five-stage lifecycle that transforms how architectural knowledge is captured, stored, and maintained.
Figure 3: The Five-Stage Integrated Workflow Lifecycle
[Placeholder for image showing the complete workflow from VP creation through OpenDocs integration]
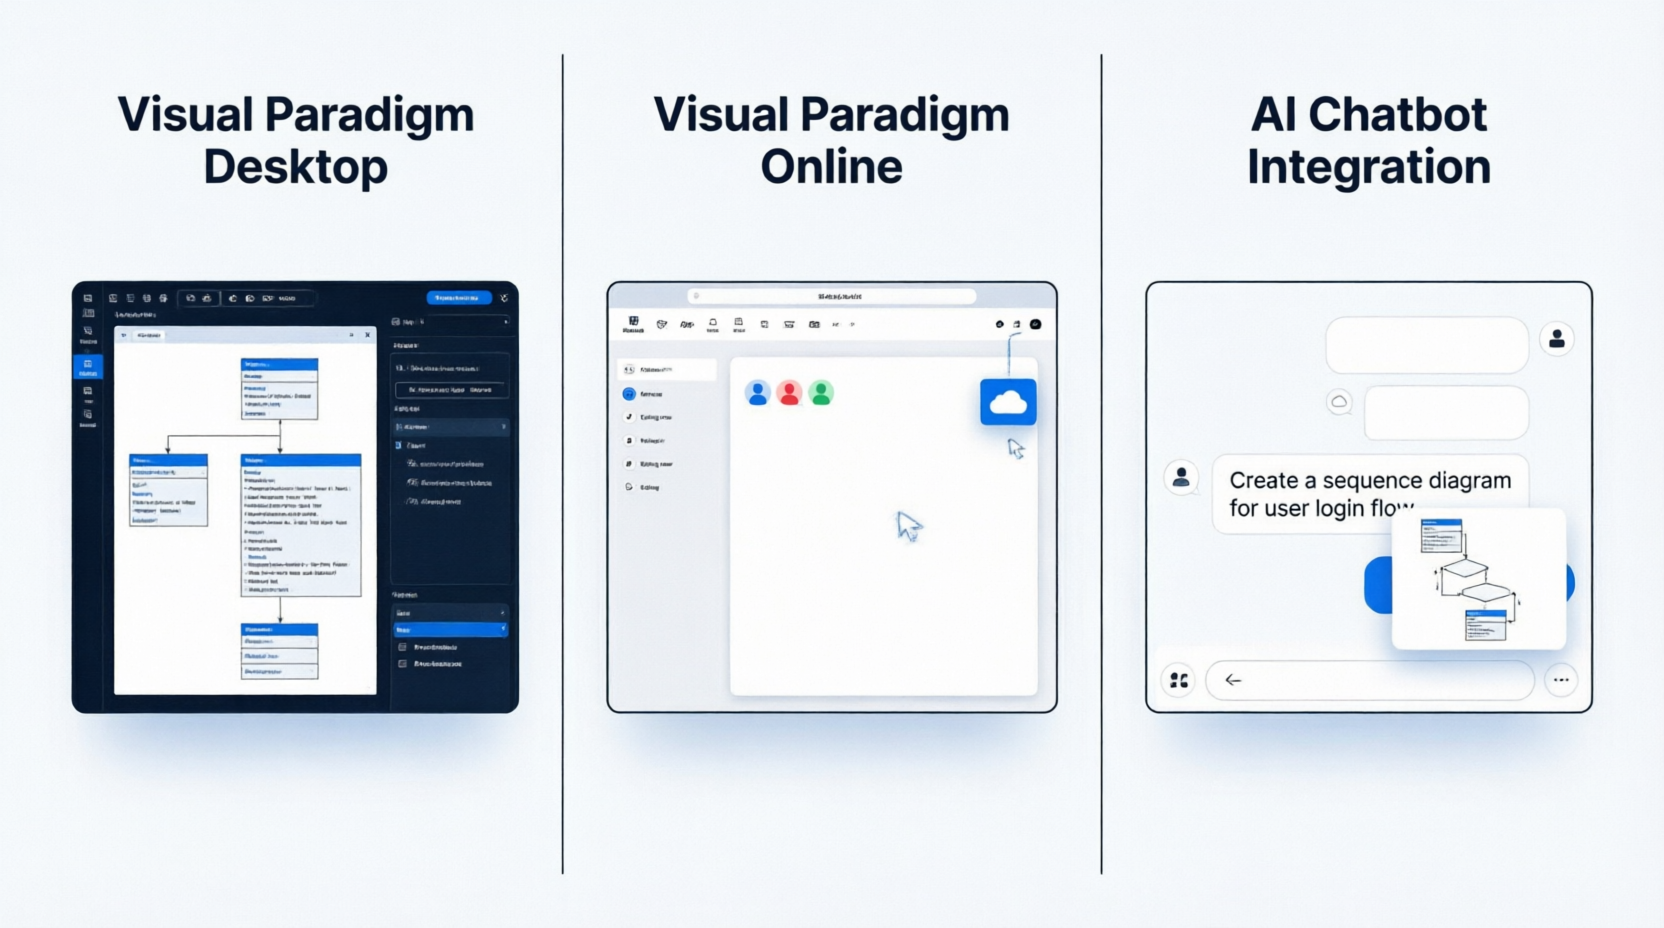
Stage 1: Creation – Multiple Entry Points
The workflow begins with diagram creation through three flexible entry points:
Visual Paradigm Desktop provides full-featured modeling capabilities for complex enterprise architectures, supporting UML, BPMN, ERD, and other industry-standard notations. Teams use this for detailed technical specifications requiring precision and comprehensive element libraries.
Visual Paradigm Online enables real-time collaborative modeling, allowing distributed teams to work simultaneously on system designs. This cloud-based approach proved particularly valuable during TechFlow’s transition to remote-first operations.
AI Chatbot Integration offers rapid prototyping capabilities, where architects can describe system requirements in natural language and receive initial diagram drafts. This accelerated the early design phase by approximately 40%, according to internal metrics.
Figure 4: Three Entry Points for Diagram Creation
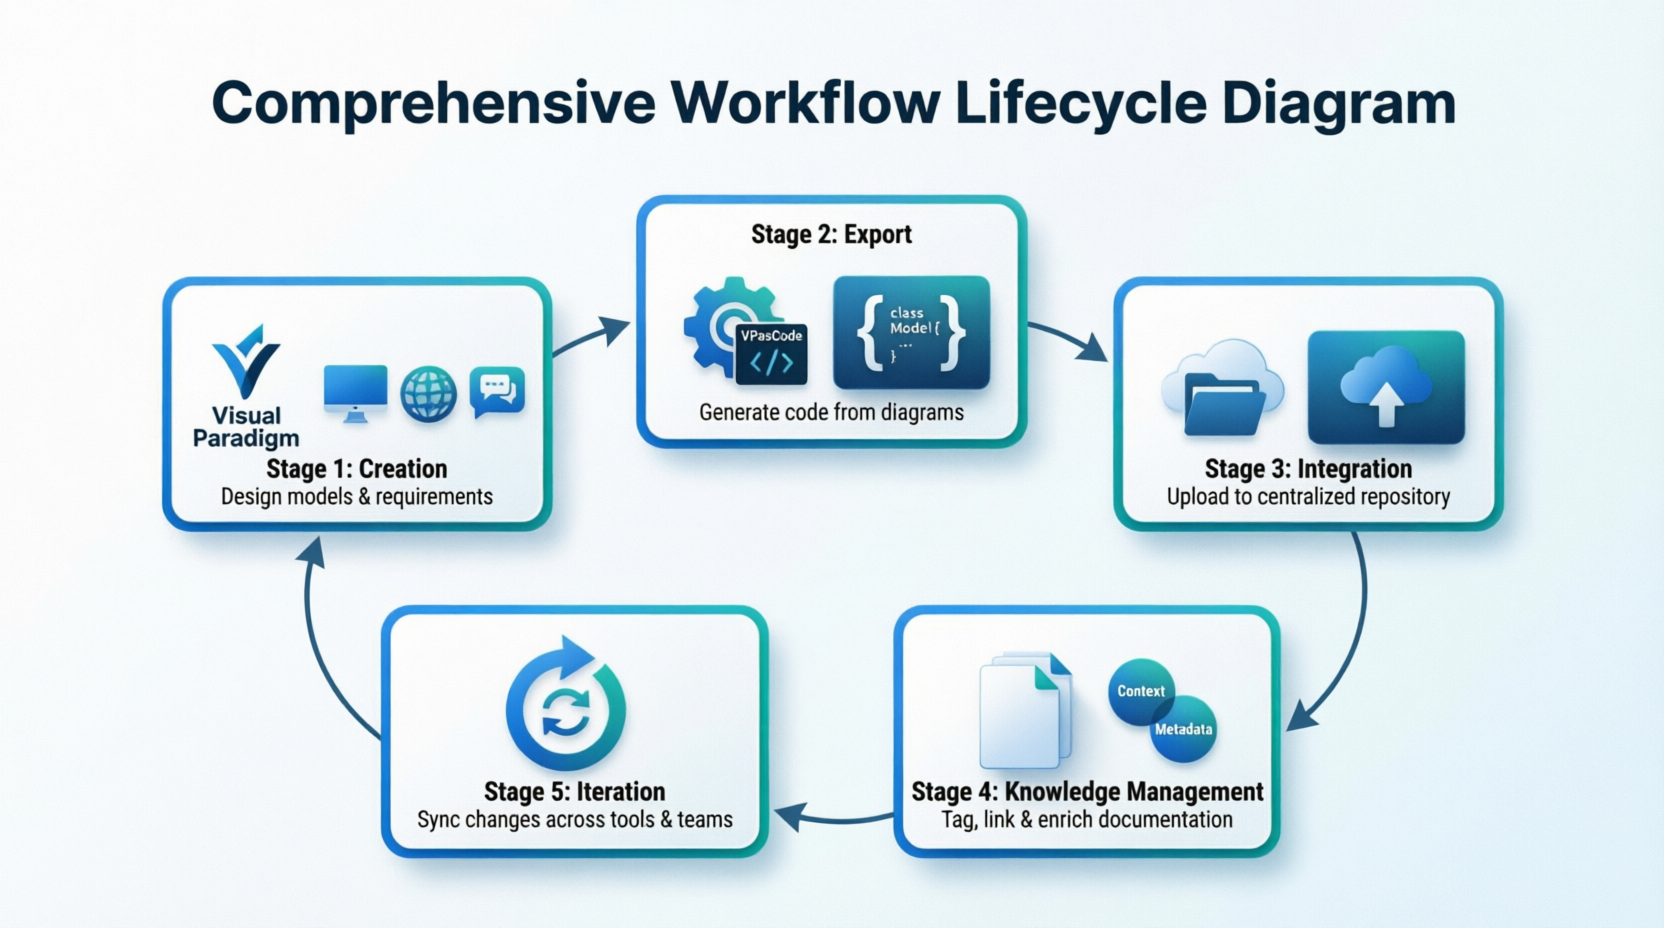
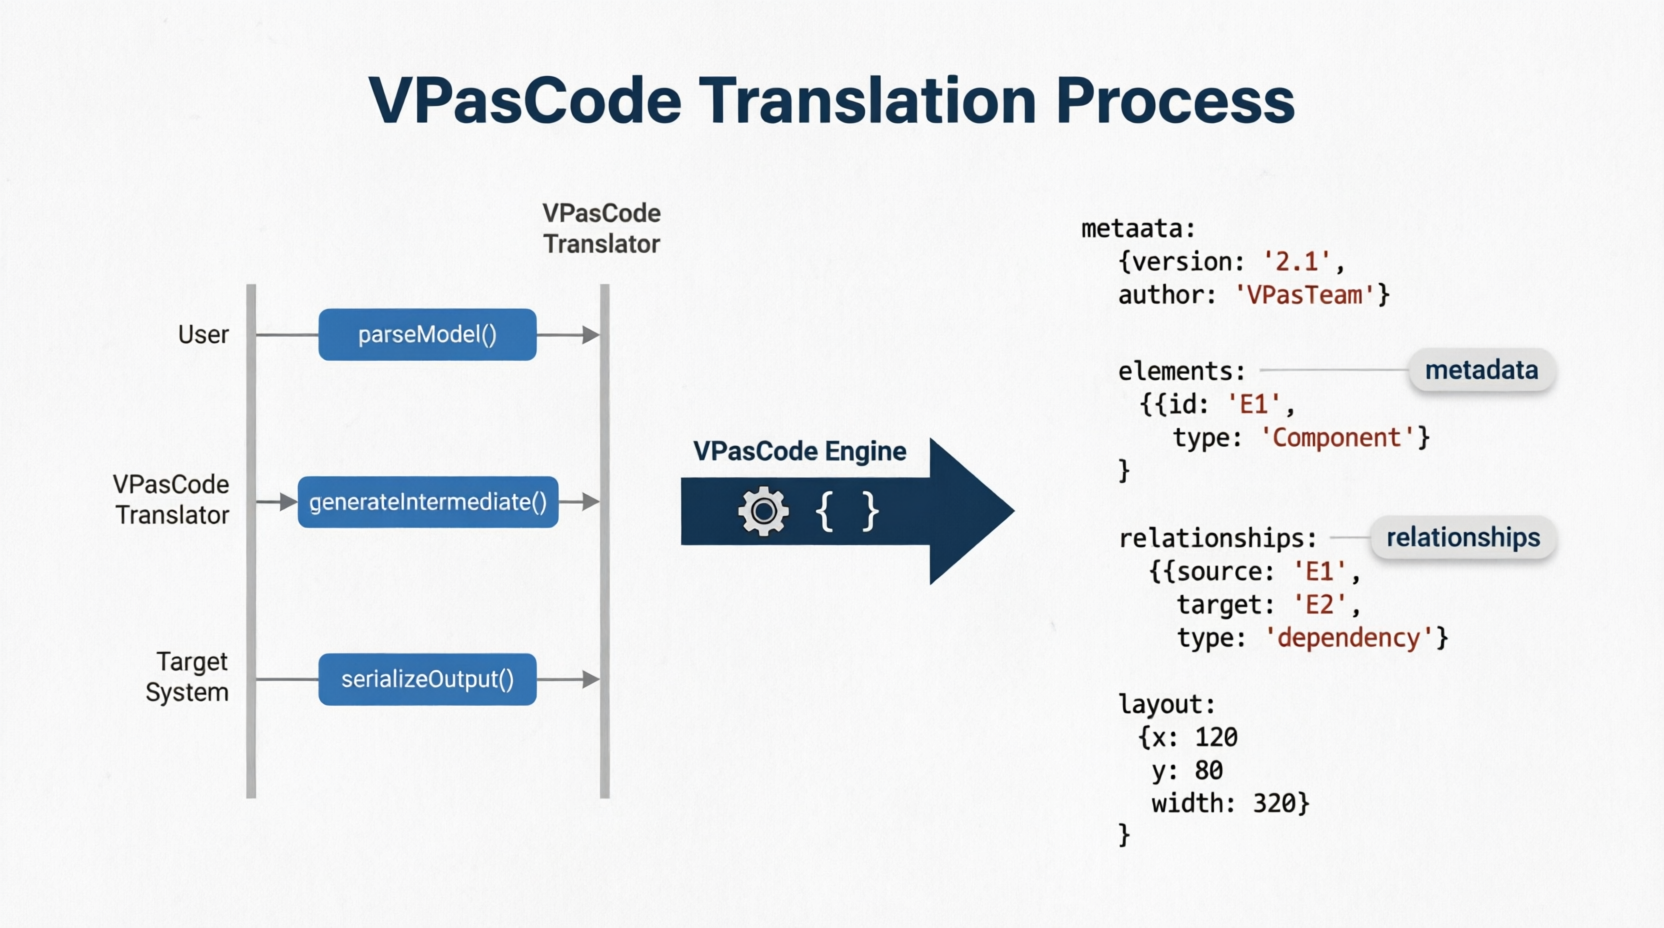
Stage 2: Export – The VPasCode Translation Engine
VPasCode serves as the critical middleware component, converting visual diagrams into structured, machine-readable formats. Unlike traditional image exports that lose semantic information, VPasCode preserves:
-
Element metadata and properties
-
Relationship types and cardinalities
-
Layout positioning data
-
Embedded annotations and notes
-
Version history markers
This structured output maintains the diagram’s intelligence while making it programmatically accessible for downstream integration.
Figure 5: VPasCode Translation Process
Stage 3: Integration – Publishing to OpenDocs
The structured diagram data flows directly into OpenDocs, TechFlow’s centralized documentation repository. Rather than embedding static images, the integration inserts live diagram references that maintain their connection to the source model.
Key integration features include:
-
Automatic thumbnail generation for document previews
-
Metadata tagging for searchability
-
Permission inheritance from parent documents
-
Change notification subscriptions for stakeholders
Figure 6: Diagram Integration Within OpenDocs Interface
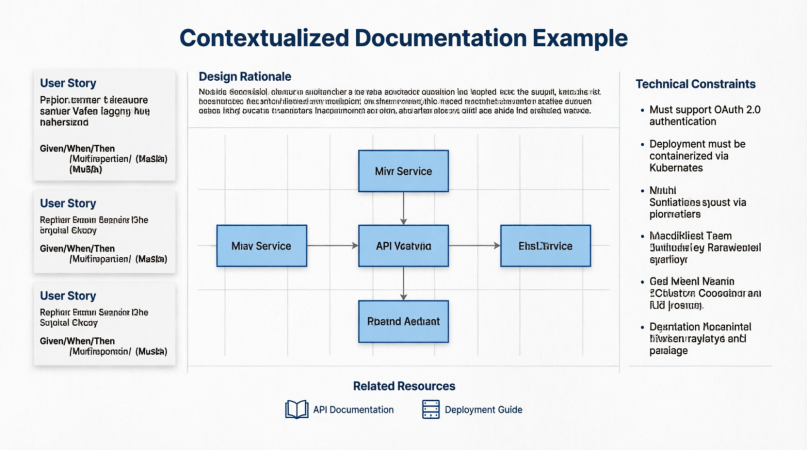
Stage 4: Knowledge Management – Contextual Enrichment
Within OpenDocs, diagrams become part of a richer knowledge ecosystem. TechFlow established documentation templates that encourage teams to wrap each diagram with:
-
Design rationale: Explaining why specific architectural choices were made
-
User stories: Connecting technical implementations to business requirements
-
Technical constraints: Documenting limitations and assumptions
-
Related resources: Linking to API documentation, test suites, and deployment guides
This contextualization transformed diagrams from isolated artifacts into nodes within a connected knowledge graph.
Figure 7: Contextualized Documentation Example
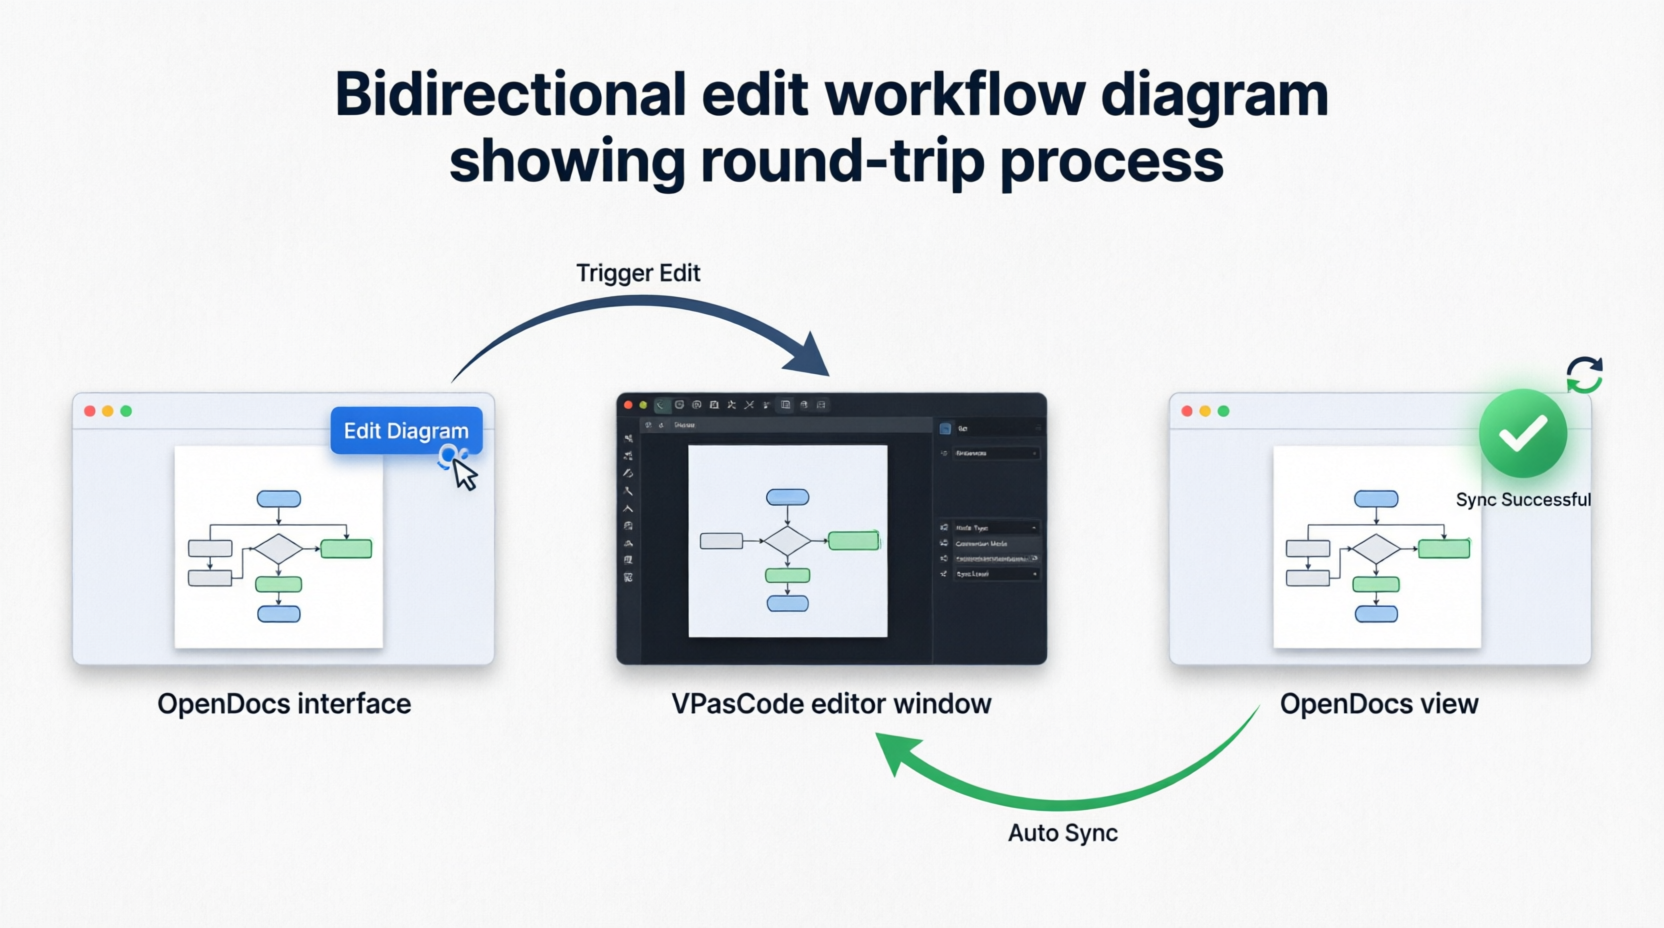
Stage 5: Iteration – Bidirectional Synchronization
The most transformative aspect of the workflow is its bidirectional nature. When requirements change:
-
Trigger Edit: Users click “Edit Diagram” directly within OpenDocs
-
Seamless Transition: The diagram opens in VPasCode with full editing capabilities
-
Modify & Save: Changes are made using familiar Visual Paradigm tools
-
Automatic Sync: Updates propagate back to OpenDocs without manual re-upload
This closed-loop system eliminated the version control nightmares that previously plagued the organization.
Figure 8: Bidirectional Edit Workflow
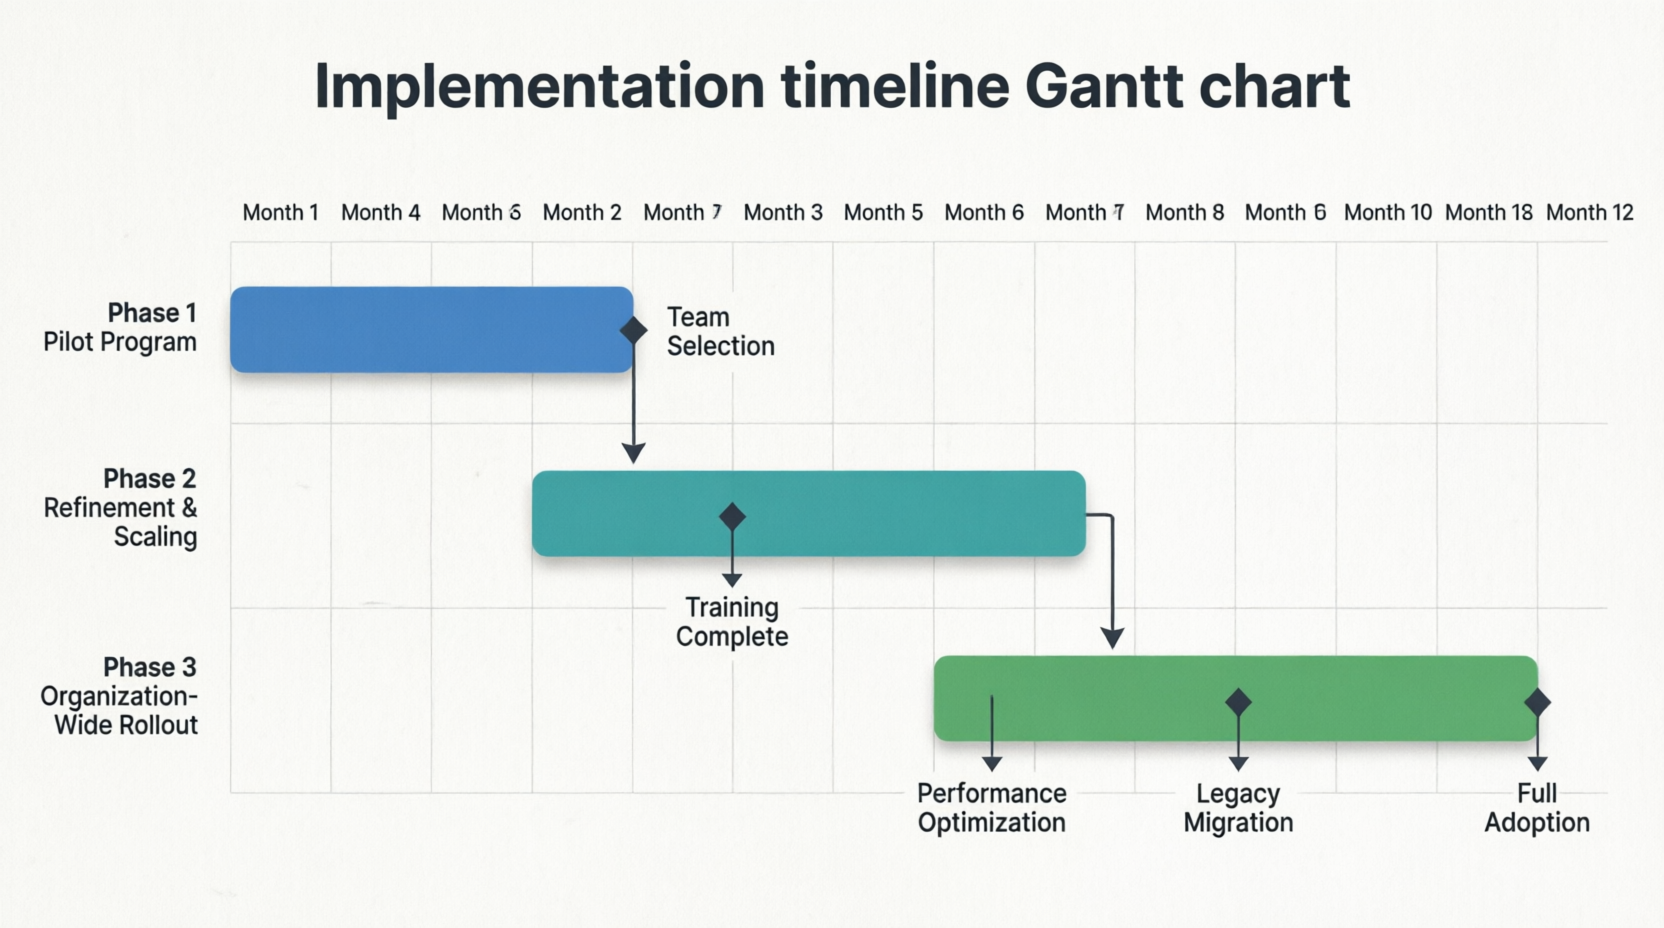
Implementation Journey
Phase 1: Pilot Program (Months 1-2)
TechFlow selected three pilot teams representing different domains:
-
Core Banking Platform team (complex microservices architecture)
-
Mobile App team (rapid iteration cycles)
-
Data Analytics team (heavy visualization requirements)
Initial setup involved:
-
Configuring VPasCode connectors for each team’s Visual Paradigm instances
-
Creating OpenDocs templates with diagram integration fields
-
Training sessions for 45 team members
-
Establishing governance guidelines for diagram standards
Early Challenges:
-
Resistance from senior architects accustomed to traditional workflows
-
Initial performance concerns with large diagram synchronization
-
Learning curve for proper contextual documentation practices
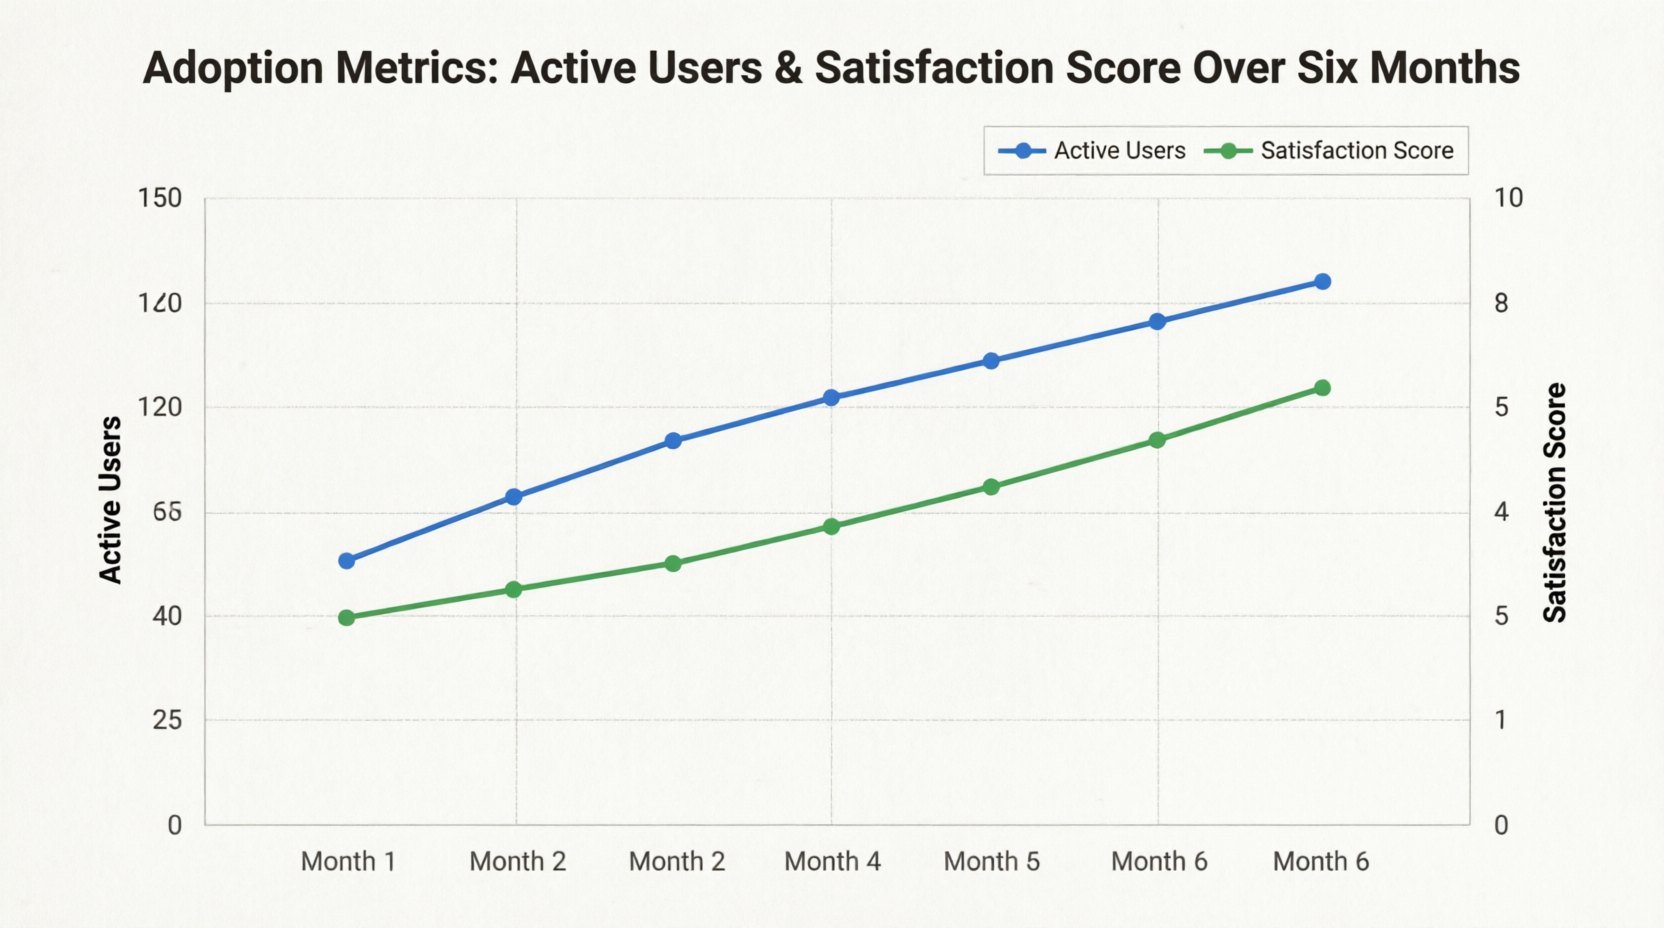
Phase 2: Refinement and Scaling (Months 3-6)
Based on pilot feedback, TechFlow implemented several optimizations:
Performance Improvements:
-
Implemented incremental sync for large diagrams (>500 elements)
-
Added background processing for non-critical updates
-
Optimized thumbnail generation algorithms
Workflow Enhancements:
-
Created quick-start templates for common diagram types
-
Developed keyboard shortcuts for frequent actions
-
Integrated with existing CI/CD pipelines for automated documentation builds
Cultural Adoption:
-
Established “Documentation Champions” in each team
-
Introduced gamification elements (documentation quality scores)
-
Incorporated documentation practices into sprint retrospectives
Figure 9: Adoption Metrics Over Six Months
Phase 3: Organization-Wide Rollout (Months 7-12)
By month seven, the integrated workflow demonstrated sufficient success metrics to justify full organizational adoption. Key rollout activities included:
-
Migration of 2,300+ existing diagrams from legacy storage
-
Integration with HR onboarding processes for new hires
-
Establishment of Center of Excellence for documentation best practices
-
Development of advanced training modules for power users
Results and Impact
Quantitative Outcomes
After twelve months of implementation, TechFlow measured significant improvements across multiple dimensions:
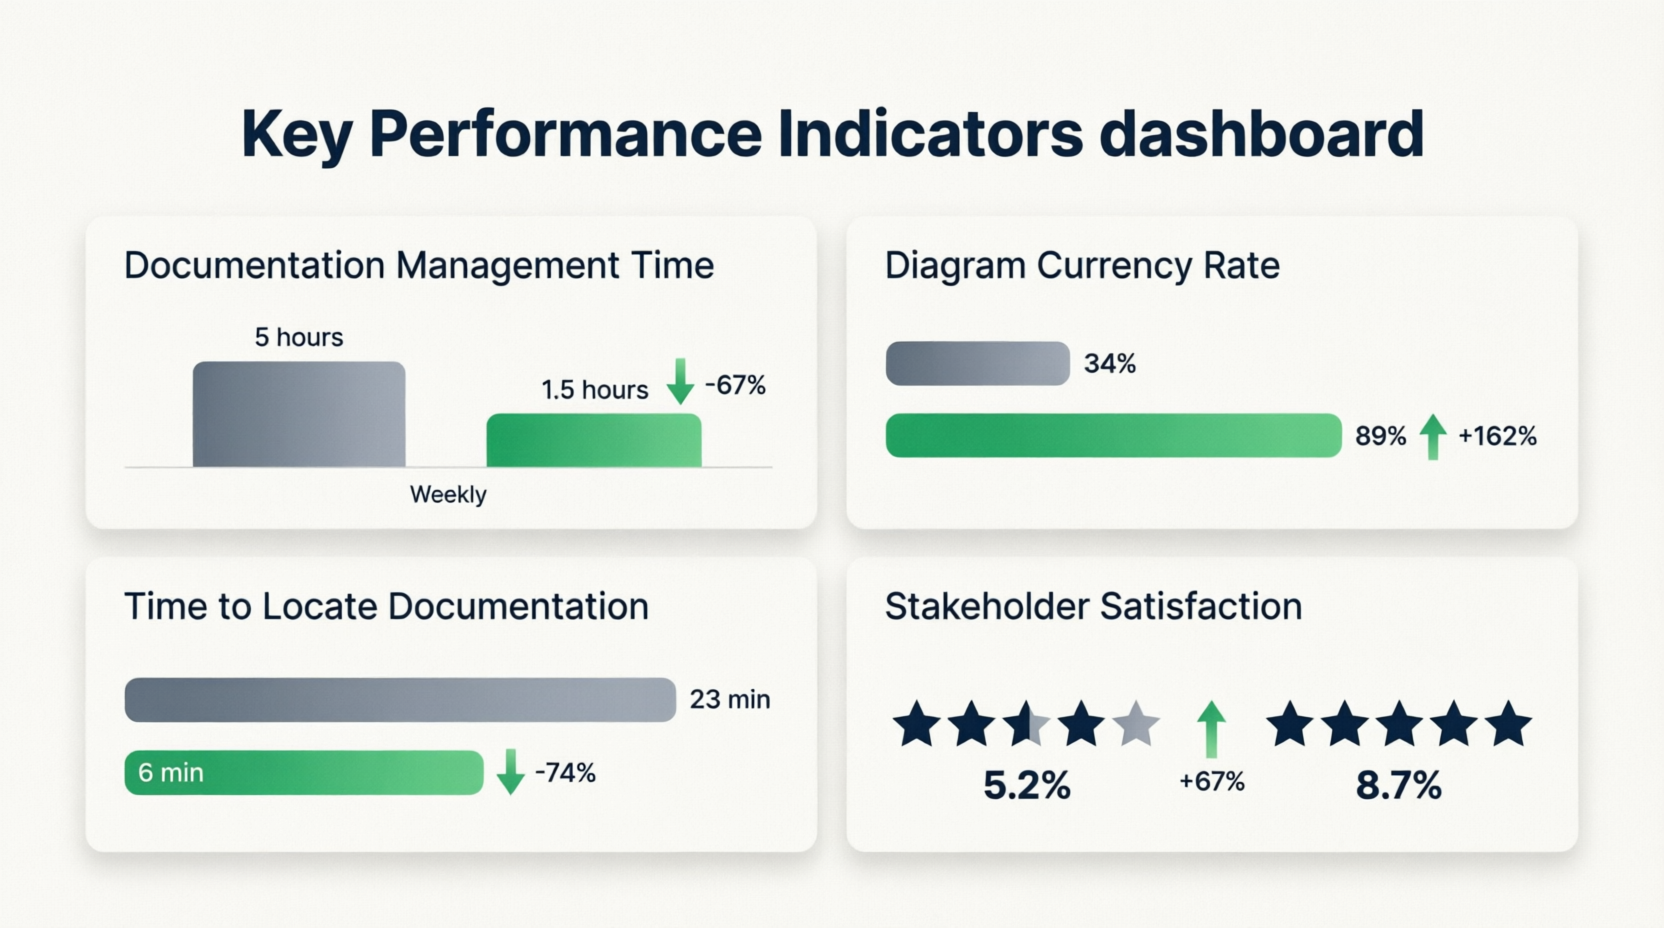
| Metric | Before Integration | After Integration | Improvement |
|---|---|---|---|
| Time spent managing documentation assets | 4-6 hours/week per developer | 1-2 hours/week per developer | 67% reduction |
| Percentage of diagrams updated within 30 days of system changes | 34% | 89% | 162% increase |
| Average time to locate relevant architectural documentation | 23 minutes | 6 minutes | 74% reduction |
| New hire onboarding time (architecture understanding) | 3 weeks | 1.5 weeks | 50% reduction |
| Stakeholder satisfaction with documentation clarity | 5.2/10 | 8.7/10 | 67% increase |
Figure 10: Key Performance Indicators Dashboard
Qualitative Benefits
Beyond measurable metrics, teams reported substantial qualitative improvements:
Enhanced Collaboration:
Product managers could now engage meaningfully with technical discussions, referencing specific diagram elements within OpenDocs comments. Cross-functional alignment improved significantly.
Reduced Cognitive Load:
Developers no longer needed to maintain mental maps of which diagrams were current. The single source of truth principle reduced decision fatigue and context-switching overhead.
Improved Knowledge Retention:
When senior engineers departed, their architectural insights remained accessible through well-contextualized diagrams rather than disappearing with tribal knowledge.
Accelerated Decision-Making:
Architecture review boards could evaluate proposals faster, with all supporting materials automatically synchronized and readily available.
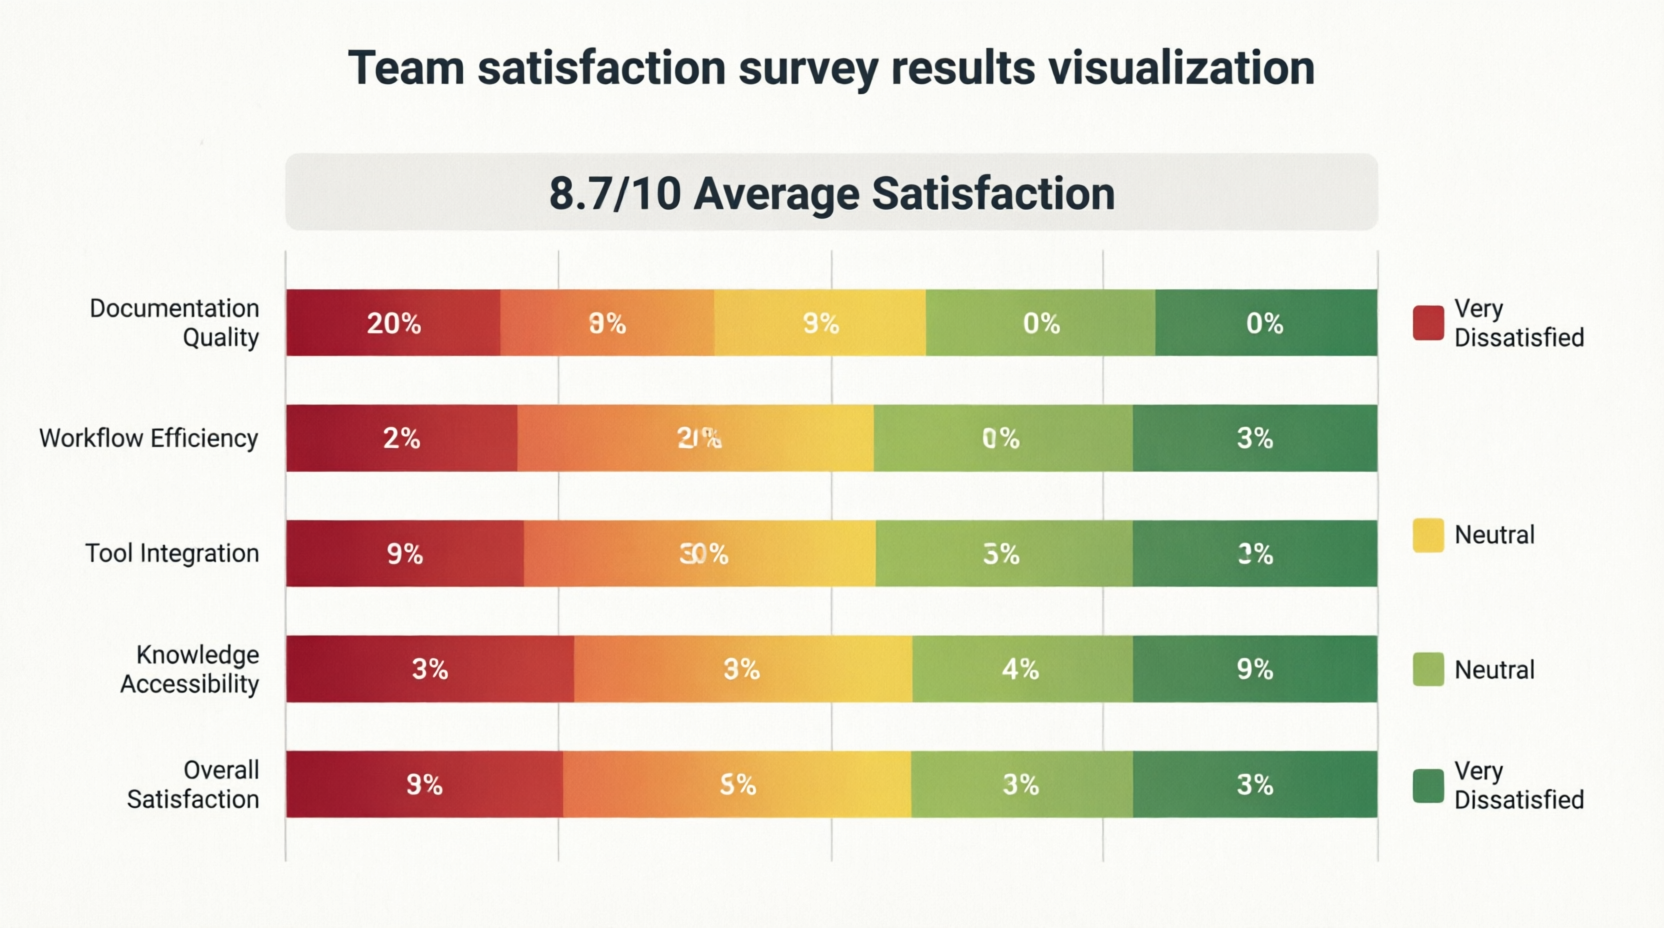
Figure 11: Team Satisfaction Survey Results
ROI Analysis
TechFlow calculated the return on investment for the integration project:
Costs:
-
VPasCode licensing and configuration: $45,000
-
Training and change management: $30,000
-
Internal development time for customization: $60,000
-
Total Investment: $135,000
Annual Savings:
-
Reduced developer time on documentation management: $280,000
-
Decreased onboarding costs: $95,000
-
Avoided rework from outdated documentation: $120,000
-
Improved stakeholder alignment (reduced meeting time): $65,000
-
Total Annual Savings: $560,000
First-Year ROI: 315%
Best Practices and Lessons Learned
Success Factors
Through the implementation journey, TechFlow identified several critical success factors:
1. Start with Strong Governance
Establish clear naming conventions, diagram standards, and review processes before scaling. Inconsistent practices early on created technical debt that required significant cleanup effort.
2. Invest in Change Management
Technology alone doesn’t drive adoption. Dedicated change management resources, including documentation champions and regular feedback loops, proved essential for cultural transformation.
3. Prioritize User Experience
The bidirectional editing feature only delivers value if it’s genuinely seamless. Investing in UI/UX refinements and performance optimization prevented user frustration and abandonment.
4. Context is King
Diagrams without surrounding explanation provide limited value. Enforcing documentation templates that require rationale, constraints, and related resources maximized knowledge transfer effectiveness.
5. Measure and Iterate
Regular assessment of adoption metrics and user feedback enabled continuous improvement. Monthly retrospectives specifically focused on documentation practices kept momentum strong.
Common Pitfalls to Avoid
Over-Engineering Early On:
Attempting to integrate every possible diagram type and use case initially created complexity that slowed adoption. Starting with high-value scenarios and expanding gradually proved more effective.
Neglecting Legacy Content:
Focusing exclusively on new diagrams while ignoring thousands of existing assets created a fragmented experience. Allocating resources for systematic migration ensured consistency.
Insufficient Training:
Assuming that familiarity with Visual Paradigm and OpenDocs individually would translate to proficiency with the integrated workflow led to early struggles. Structured training programs addressing the combined toolchain were necessary.
Underestimating Cultural Resistance:
Some team members viewed enhanced documentation requirements as bureaucratic overhead. Demonstrating tangible time savings and quality improvements helped overcome this resistance, but required patience and consistent communication.
Figure 12: Implementation Timeline with Key Milestones
Technical Considerations
Architecture Decisions
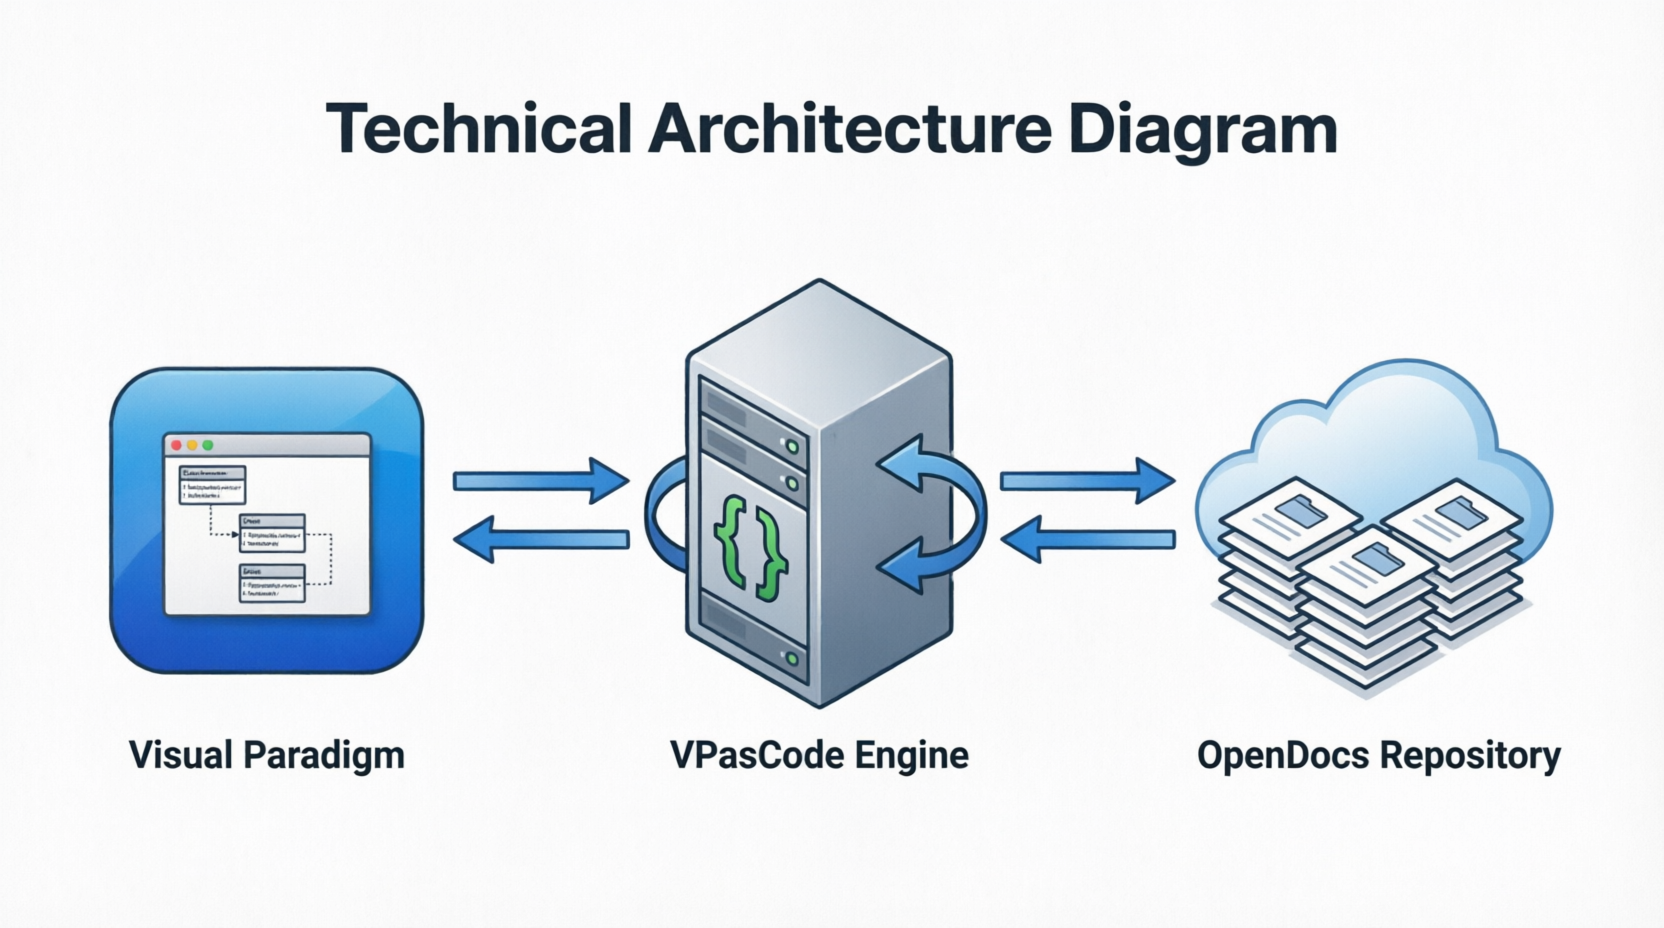
Why VPasCode as Middleware?
Direct integration between Visual Paradigm and OpenDocs wasn’t feasible due to incompatible data models. VPasCode’s structured intermediate format provided the necessary abstraction layer while preserving semantic richness.
Synchronization Strategy:
TechFlow chose event-driven synchronization over scheduled batch processing. This ensured near-real-time updates while minimizing unnecessary processing overhead. Webhooks triggered updates only when actual changes occurred.
Security and Access Control:
Diagram access permissions inherited from parent OpenDocs documents, simplifying administration. Additional encryption-at-rest was implemented for diagrams containing sensitive architectural information.
Scalability Insights
As usage grew from 45 pilot users to 150+ engineers, several scalability considerations emerged:
Performance Optimization:
-
Implemented lazy loading for diagrams in large documents
-
Cached frequently accessed diagram thumbnails
-
Used differential sync to minimize data transfer
Storage Management:
-
Archived historical diagram versions after 90 days
-
Compressed VPasCode intermediate representations
-
Implemented tiered storage based on access patterns
Monitoring and Alerting:
-
Tracked synchronization success rates
-
Monitored VPasCode processing times
-
Alerted on failed integrations for rapid resolution
Figure 13: System Architecture Diagram
Future Roadmap
Building on the success of the initial implementation, TechFlow has outlined several enhancement initiatives:
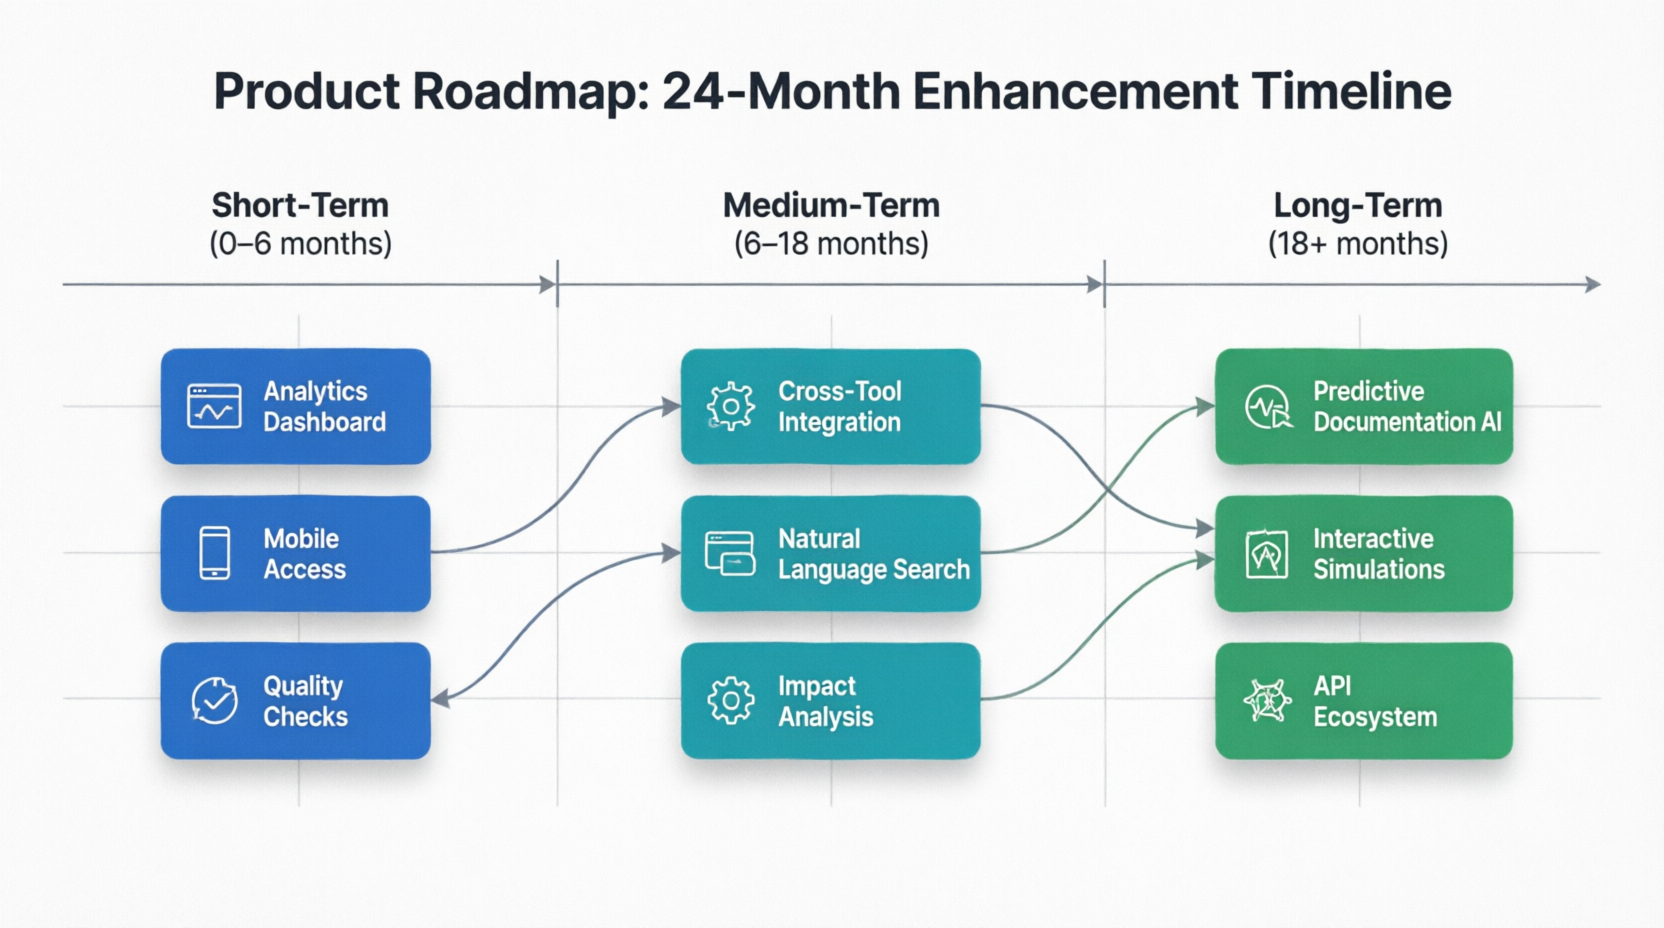
Short-Term (Next 6 Months)
-
Advanced Analytics: Dashboard showing documentation health metrics, identifying stale content and coverage gaps
-
Mobile Access: Optimized viewing experience for diagrams on mobile devices within OpenDocs
-
Automated Quality Checks: AI-powered suggestions for improving diagram clarity and documentation completeness
Medium-Term (6-18 Months)
-
Cross-Tool Integration: Extending the workflow to incorporate additional modeling tools beyond Visual Paradigm
-
Natural Language Queries: Enable searching documentation using conversational queries that reference diagram elements
-
Automated Impact Analysis: When diagrams change, automatically identify and notify affected documentation sections
Long-Term (18+ Months)
-
Predictive Documentation: ML models suggesting documentation updates based on code changes and commit patterns
-
Interactive Simulations: Embedding executable simulations within diagrams for dynamic exploration of system behavior
-
Ecosystem Expansion: Opening APIs for third-party tools to participate in the integrated documentation workflow
Figure 14: Product Roadmap Visualization
Conclusion
The integration of Visual Paradigm with OpenDocs through VPasCode represents more than a technical achievement—it embodies a fundamental shift in how organizations approach knowledge management in software development. By eliminating the artificial separation between visual models and textual documentation, TechFlow Solutions created a living knowledge ecosystem that evolves naturally alongside their systems.
The results speak clearly: 67% reduction in documentation management overhead, 162% improvement in diagram currency, and a first-year ROI exceeding 300%. Yet beyond these metrics lies a more profound transformation—developers who view documentation not as a burden but as an integral part of their craft, stakeholders who can confidently navigate complex architectures, and an organization that retains and leverages its collective intelligence effectively.
For organizations grappling with similar documentation challenges, the path forward is clear. The tools likely already exist within your technology stack; the opportunity lies in connecting them thoughtfully, implementing with attention to both technical excellence and human factors, and committing to the cultural change that makes integrated documentation sustainable.
As software systems continue growing in complexity and development methodologies demand ever-greater agility, the ability to maintain accurate, accessible, and contextual architectural knowledge becomes not just advantageous but essential. The Visual Paradigm to OpenDocs workflow demonstrates that with the right integration approach, documentation can transform from a persistent pain point into a genuine competitive advantage.
The future of technical documentation is not static pages or isolated diagrams—it’s living, breathing knowledge systems that grow smarter with every interaction. Organizations that embrace this vision today will find themselves better positioned to innovate, collaborate, and succeed in tomorrow’s increasingly complex technological landscape.
Figure 15: The Vision of Living Documentation
References
Reference
- Visual Paradigm OpenDocs Features: Overview of OpenDocs capabilities as an AI-powered knowledge management platform that merges technical documentation with live diagramming.
- From Static Snapshots to Living Knowledge: Article discussing how Visual Paradigm OpenDocs unifies documentation and modeling to eliminate documentation drift through live, interactive diagrams.
- Visual Paradigm Official Website: Main website for Visual Paradigm, providing comprehensive information about their suite of diagramming and knowledge management tools.
- Visual Paradigm OpenDocs Beginner’s Guide: Beginner’s guide to getting started with Visual Paradigm OpenDocs, covering basic setup and usage.
- From Concept to Knowledge Base: A Third-Party Review: Third-party review examining Visual Paradigm’s OpenDocs workflow from initial concept through knowledge base creation.
- Sync AI Diagram to OpenDocs Pipeline Guide: Comprehensive guide explaining how to sync AI-generated diagrams to the OpenDocs pipeline for seamless documentation integration.
- Visual Paradigm Cloud Diagramming Tool: Information about Visual Paradigm’s cloud-based diagramming solutions for collaborative visual modeling.
- AI Profile Diagram Generation in OpenDocs: Release announcement detailing AI-powered UML Profile Diagram generation capabilities within OpenDocs.
- AI-Powered Data Flow Diagram Support in OpenDocs: Update introducing AI-powered Data Flow Diagram (DFD) support in OpenDocs for automated diagram creation.
- OpenDocs AI Timeline Diagram Integration: Release update covering AI timeline diagram integration features in OpenDocs for project management documentation.
- OpenDocs AI-Powered Knowledge Platform Launch: Announcement of OpenDocs as an AI-powered knowledge platform combining documentation and diagramming capabilities.
- OpenDocs Video Tutorial: Video tutorial demonstrating OpenDocs features and functionality for new users.
- OpenDocs AI Tool: Direct access to the OpenDocs AI tool for generating and managing documentation with artificial intelligence assistance.
- Visual Paradigm Team Collaboration Guide: Official team collaboration guide introducing Visual Paradigm’s collaborative features and workflows.
- Share Digital Bookshelf to OpenDocs: Guide explaining how to share digital bookshelves from VP Online directly into OpenDocs documentation.
- AI Breakdown Structure Chart Maker in OpenDocs: Release featuring AI-powered breakdown structure chart creation capabilities within OpenDocs.
- Visual Paradigm Online Export to OpenDocs: Guide for exporting diagrams from Visual Paradigm Online directly to OpenDocs for integrated documentation.
This case study is based on the integrated Visual Paradigm to OpenDocs workflow methodology. Specific metrics and organizational details have been adapted for illustrative purposes while maintaining fidelity to the core workflow principles described in the original article.