Introduction
In the fast-paced world of software development and system architecture, the gap between conceptual design and visual documentation has long been a bottleneck. Traditional diagramming tools often rely on cumbersome drag-and-drop interfaces that are difficult to version control, hard to collaborate on in real-time, and prone to becoming outdated the moment code changes. Enter VPasCode (Visual Paradigm as Code), a cloud-native platform that is reshaping how engineers, architects, and product managers approach diagramming.
As someone who has spent years navigating the complexities of technical documentation, I recently explored VPasCode to see if its promise of “Diagram-as-Code” (DaC) could truly streamline our workflow. This review dives into my experience with the platform, exploring its multi-engine capabilities, AI-driven features, and seamless ecosystem integration. Whether you are a developer looking to document microservices or a product manager mapping out user flows, this guide will walk you through what makes VPasCode a compelling tool for modern teams.

What is VPasCode?
VPasCode is a browser-based platform that converts plain-text markup syntax into high-fidelity visual diagrams. It eliminates the traditional manual mechanics of diagram creation, allowing teams to build, version-control, and share architectural diagrams directly from their keyboards. The core philosophy is simple: treat diagrams like code. This means they can be stored in repositories, reviewed via pull requests, and updated with precision.
The platform features a sleek two-column layout: an IDE-grade code editor on the left and a live vector preview canvas on the right. This immediate feedback loop ensures that what you type is exactly what you see, reducing the friction often associated with visual design tools.
Multi-Engine Syntax Platform
One of the standout features of VPasCode is its versatility. It supports three core diagramming compilers from a single workspace interface, catering to different needs and preferences within a technical team.
1. Graphviz (DOT)
Graphviz is ideal for plotting relational logic, dependency trees, hierarchical structures, and directed graphs. It is particularly powerful for creating Data Flow Diagrams (DFDs) and system architecture maps where clarity of flow is paramount.
Below is an example of a simple Order Processing System DFD rendered using Graphviz DOT syntax in VPasCode:
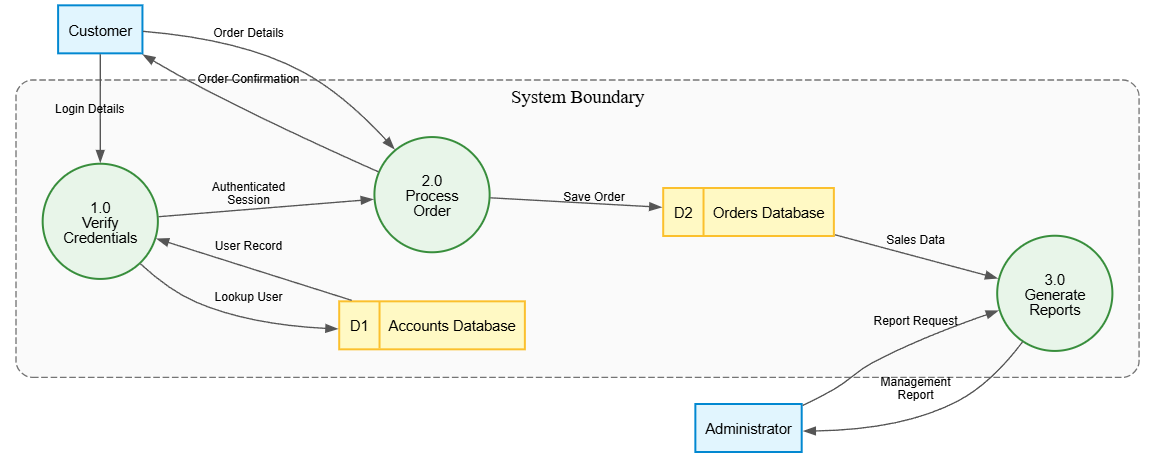
Note: The above image represents the visual output of the following DOT code:
digraph DFD {
    // --- GRAPH STYLE ---
    graph [
        rankdir = LR             // Left-to-right flow
        splines = true            // Curved arrows for cleaner paths
        overlap = false           // Prevent node overlaps
        nodesep = 0.5             // Horizontal space between nodes
        ranksep = 0.8             // Vertical space between ranks
        fontname = "Helvetica,Arial,sans-serif"
        fontsize = 12
    ]

    // --- NODE STYLES ---
    node [
        fontname = "Helvetica,Arial,sans-serif"
        fontsize = 11
        penwidth = 1.5
    ]

    // External Entities (Kept outside the container)
    node [shape = box, style = "filled", fillcolor = "#E1F5FE", color = "#0288D1"]
    Customer; Administrator;

    // --- SYSTEM BOUNDARY CONTAINER ---
    subgraph cluster_SystemBoundary {
        label = "System Boundary";
        fontname = "Helvetica,Arial,sans-serif; bold";
        fontsize = 14;
        color = "#757575";       // Grey border for the container
        style = "dashed,rounded"; // Dashed line to show system boundary
        bgcolor = "#FAFAFA";     // Light background inside container
        margin = 20;             // Padding inside container

        // Processes (Inside Container)
        node [shape = circle, style = "filled", fillcolor = "#E8F5E9", color = "#388E3C", fixedsize = true, width = 1.2]
        P1 [label="1.0\nVerify\nCredentials"];
        P2 [label="2.0\nProcess\nOrder"];
        P3 [label="3.0\nGenerate\nReports"];

        // Data Stores (Inside Container)
        node [shape = record, style = "filled", fillcolor = "#FFF9C4", color = "#FBC02D", fixedsize = false]
        AccountsDS [label="{ <id> D1 | Accounts Database }"];
        OrdersDS   [label="{ <id> D2 | Orders Database }"];
    }

    // --- EDGE STYLES (Data Flows) ---
    edge [
        fontname = "Helvetica,Arial,sans-serif"
        fontsize = 9
        color = "#555555"
        arrowsize = 0.8
    ]

    // --- DATA FLOWS ---
    // External Entity to Process
    Customer -> P1 [label="Login Details"];
    Customer -> P2 [label="Order Details"];
    Administrator -> P3 [label="Report Request"];

    // Process to Process
    P1 -> P2 [label="Authenticated\nSession"];

    // Process to Data Store
    P1 -> AccountsDS [label="Lookup User"];
    P2 -> OrdersDS [label="Save Order"];

    // Data Store to Process
    AccountsDS -> P1 [label="User Record"];
    OrdersDS -> P3 [label="Sales Data"];

    // Process to External Entity
    P2 -> Customer [label="Order Confirmation"];
    P3 -> Administrator [label="Management\nReport"];
}
2. PlantUML
For robust enterprise systems, database schemas, and software architecture blueprints, PlantUML remains a gold standard. VPasCode integrates this engine seamlessly, allowing for detailed class diagrams, sequence diagrams, and component maps that adhere to strict UML standards.
3. Mermaid.js
Mermaid.js is perfect for modern, markdown-inspired diagrams. It is widely used for flowcharts, state machines, timelines, and Gantt charts. Its simplicity makes it accessible for non-engineers, such as product managers or business analysts, who need to visualize processes without deep coding knowledge.
To illustrate the complexity VPasCode can handle, here is a more intricate Hotel Management Information System (MIS) DFD:
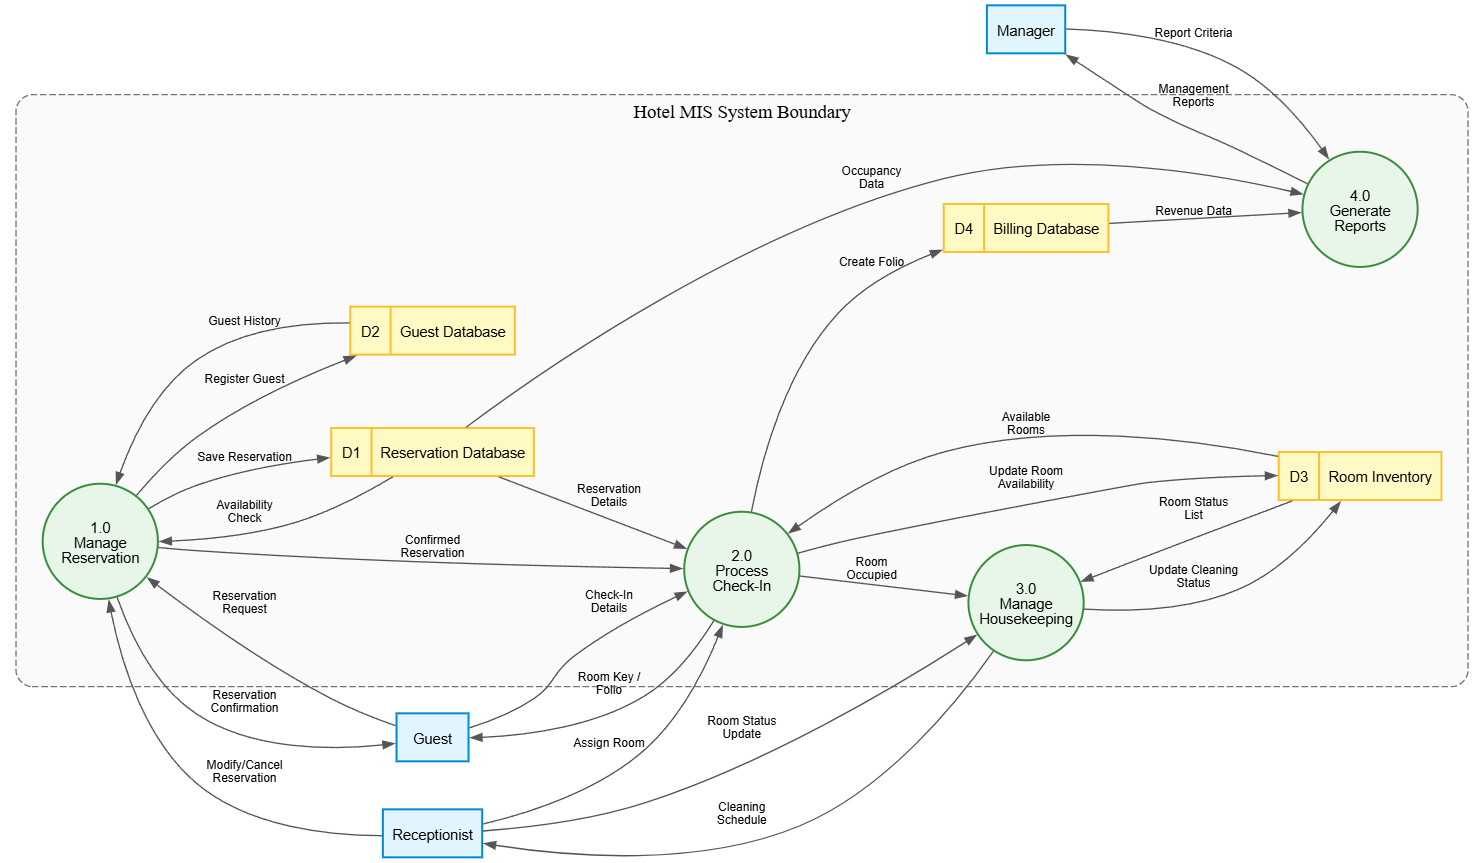
Note: The above image represents the visual output of the following DOT code:
digraph DFD {
    // --- GRAPH STYLE ---
    graph [
        rankdir = LR             // Left-to-right flow
        splines = true            // Curved arrows for cleaner paths
        overlap = false           // Prevent node overlaps
        nodesep = 0.5             // Horizontal space between nodes
        ranksep = 0.8             // Vertical space between ranks
        fontname = "Helvetica,Arial,sans-serif"
        fontsize = 12
    ]

    // --- NODE STYLES ---
    node [
        fontname = "Helvetica,Arial,sans-serif"
        fontsize = 11
        penwidth = 1.5
    ]

    // External Entities (Kept outside the container)
    node [shape = box, style = "filled", fillcolor = "#E1F5FE", color = "#0288D1"]
    Guest; Receptionist; Manager;

    // --- SYSTEM BOUNDARY CONTAINER ---
    subgraph cluster_SystemBoundary {
        label = "Hotel MIS System Boundary";
        fontname = "Helvetica,Arial,sans-serif; bold";
        fontsize = 14;
        color = "#757575";
        style = "dashed,rounded";
        bgcolor = "#FAFAFA";
        margin = 20;

        // Processes (Inside Container)
        node [shape = circle, style = "filled", fillcolor = "#E8F5E9", color = "#388E3C", fixedsize = true, width = 1.2]
        P1 [label="1.0\nManage\nReservation"];
        P2 [label="2.0\nProcess\nCheck-In"];
        P3 [label="3.0\nManage\nHousekeeping"];
        P4 [label="4.0\nGenerate\nReports"];

        // Data Stores (Inside Container)
        node [shape = record, style = "filled", fillcolor = "#FFF9C4", color = "#FBC02D", fixedsize = false]
        ReservationDS [label="{ <id> D1 | Reservation Database }"];
        GuestDS       [label="{ <id> D2 | Guest Database }"];
        RoomDS        [label="{ <id> D3 | Room Inventory }"];
        BillingDS     [label="{ <id> D4 | Billing Database }"];
    }

    // --- EDGE STYLES (Data Flows) ---
    edge [
        fontname = "Helvetica,Arial,sans-serif"
        fontsize = 9
        color = "#555555"
        arrowsize = 0.8
    ]

    // --- DATA FLOWS ---
    // External Entity to Process
    Guest -> P1     [label="Reservation\nRequest"];
    Guest -> P2     [label="Check-In\nDetails"];
    Receptionist -> P1 [label="Modify/Cancel\nReservation"];
    Receptionist -> P2 [label="Assign Room"];
    Receptionist -> P3 [label="Room Status\nUpdate"];
    Manager -> P4      [label="Report Criteria"];

    // Process to Process
    P1 -> P2 [label="Confirmed\nReservation"];
    P2 -> P3 [label="Room\nOccupied"];

    // Process to Data Store
    P1 -> ReservationDS [label="Save Reservation"];
    P1 -> GuestDS       [label="Register Guest"];
    P2 -> RoomDS        [label="Update Room\nAvailability"];
    P2 -> BillingDS     [label="Create Folio"];
    P3 -> RoomDS        [label="Update Cleaning\nStatus"];

    // Data Store to Process
    ReservationDS -> P1 [label="Availability\nCheck"];
    GuestDS -> P1       [label="Guest History"];
    RoomDS -> P2        [label="Available\nRooms"];
    ReservationDS -> P2 [label="Reservation\nDetails"];
    RoomDS -> P3        [label="Room Status\nList"];
    BillingDS -> P4     [label="Revenue Data"];
    ReservationDS -> P4 [label="Occupancy\nData"];

    // Process to External Entity
    P1 -> Guest     [label="Reservation\nConfirmation"];
    P2 -> Guest     [label="Room Key /\nFolio"];
    P3 -> Receptionist [label="Cleaning\nSchedule"];
    P4 -> Manager   [label="Management\nReports"];
}
Key Features and Capabilities
Integrated AI Assistants
One of the most impressive aspects of VPasCode is its AI integration. Users can input natural language requests, such as “Create a hotel booking system with rooms and customers,” and the platform instantly generates syntactically correct code blueprints. This feature drastically reduces the learning curve for new users and accelerates the initial drafting phase for experienced engineers.
AI Code Error Fixing
Syntax errors can be frustrating when working with code-based diagramming. VPasCode includes a one-click automated syntax repair engine that scans, detects, and fixes broken diagram syntax on the fly. This ensures that minor typos or structural mistakes don’t halt your progress, maintaining a smooth workflow.
AI Translation
For international project teams, language barriers can complicate documentation. VPasCode offers instant translation of text labels inside diagrams, supporting multiple languages. This feature is invaluable for global teams needing to share clear, localized documentation without manual rework.
One-Click Exports
Once your diagram is finalized, exporting is effortless. VPasCode allows you to download finished visual layouts immediately as resolution-independent SVG vector files or high-resolution PNG images. This flexibility ensures that your diagrams look crisp whether they are embedded in a web page or printed in a formal report.
Persistent Web URLs
Collaboration is made easier with persistent web URLs. VPasCode generates unique, shareable hyperlinks containing the active diagram scripts. This allows for swift peer reviews and discussions without the need to send large files or worry about version mismatches.
Ecosystem Integration
VPasCode does not exist in a vacuum; it is fully synchronized with the broader Visual Paradigm Ecosystem. This integration creates a seamless pipeline from idea to documentation:
[Natural Language Prompt] ➔ [VPasCode Text Editor] ➔ [OpenDocs Live Pipeline] ➔ [Git Version Control]
Through the OpenDocs Pipeline Integration, text-generated diagrams feed directly into team knowledge bases without manual exporting or image uploading. This automation ensures that documentation stays in sync with the latest design decisions.
Furthermore, because diagram files are kept entirely as text scripts, they can be stored in repositories like Git. This enables teams to track visual system modifications inside pull requests, providing a clear audit trail of how architectural decisions evolved over time.
Conclusion
VPasCode represents a significant step forward in the evolution of technical documentation. By treating diagrams as code, it bridges the gap between development workflows and visual design, offering a level of precision, version control, and collaboration that traditional tools simply cannot match. The multi-engine support ensures that whether you are working with complex UML models, simple flowcharts, or intricate data flow diagrams, there is a tool within VPasCode that fits your needs.
The integration of AI assistants further lowers the barrier to entry, making it accessible for both seasoned architects and newcomers alike. For teams looking to streamline their documentation process, enhance collaboration, and maintain up-to-date visual records of their systems, VPasCode is a powerful and worthy addition to the toolkit. As the demand for agile, accurate, and maintainable documentation grows, platforms like VPasCode are poised to become indispensable in the modern engineering landscape.
References
-
Comprehensive Guide to VPasCode by Visual Paradigm: An in-depth overview of VPasCode’s features, capabilities, and use cases for diagram-as-code workflows.
-
Mastering VPasCode: The Ultimate Guide to AI-Powered Diagram-as-Code with Multi-Engine Support: A detailed guide on leveraging AI and multi-engine support in VPasCode for efficient diagram creation.
-
Introducing VPasCode: The Ultimate Unified Text-to-Diagram Platform: Official release announcement detailing the launch and core value proposition of VPasCode.
-
From Prompt to Pattern: Mastering UML Class Diagrams with AI and Diagram-as-Code: A tutorial on using AI prompts to generate UML class diagrams within VPasCode.
-
Comprehensive Guide to VPasCode by Visual Paradigm: A repeated reference to the comprehensive guide, highlighting its importance as a primary resource.
-
Mastering VPasCode: The Ultimate Guide to AI-Powered Diagram-as-Code with Multi-Engine Support: A repeated reference to the mastering guide, emphasizing its role in understanding AI integration.
-
Introducing VPasCode: The Ultimate Unified Text-to-Diagram Platform: A repeated reference to the release announcement, underscoring the platform’s unified approach.
-
Revolutionizing Diagram Maintenance: How VPasCode’s AI Auto-Fix Eliminates Syntax Frustrations: An article focusing on the AI-powered syntax repair feature and its impact on productivity.
-
VPasCode Features Overview: A summary of key features including AI assistants, error fixing, translation, exports, and persistent URLs.
-
VPasCode: Revolutionizing Engineering Documentation with Diagram-as-Code: An external review highlighting the transformative impact of VPasCode on engineering documentation practices.
-
Visual Paradigm Home: The main website for Visual Paradigm, providing access to the broader ecosystem and tools.
-
Seamlessly Connect Diagramming to Documentation: VPasCode Integrates with OpenDocs: Details on the integration between VPasCode and OpenDocs for streamlined documentation pipelines.
-
Architecting the Agile Future: A Beginner’s Guide to UML Diagram-as-Code and AI-Powered Design: A beginner-friendly guide to adopting UML diagram-as-code and AI tools in agile environments.
-
Revolutionizing Diagram Maintenance: How VPasCode’s AI Auto-Fix Eliminates Syntax Frustrations: A repeated reference to the AI auto-fix feature, emphasizing its role in reducing maintenance overhead.